Using Polar2Grid to display NUCAPS Lapse Rates
This short tutorial will explain how Polar2Grid can show individual isobaric levels, and also lapse rates (dT/dp) between two isobaric levels.
Polar2Grid is CSPP software designed to process files either from the NOAA NODD (EDR files for NOAA-20 are here; EDR files for NOAA-21 are here) or from Direct Broadcast antenna data streams. Polar2grid creates reprojected imagery. In this example, I decided to work with data over the western United States. The NOAA-20 orbits on 18 December (here, from this website), show a descending pass over the Rockies, from the USA-Canada border at 0938 UTC to Los Angeles at about 0943 UTC. The data for this were downloaded from the AWS Cloud for NOAA-20, and a list of the files is shown below. Times for the granules listed start at 09:37:22.9 and end at 09:43:44.7.
(base) [scottl@machine NUCAPSData]$ ls -1
NUCAPS-EDR_v3r2_j01_s202412180937229_e202412180937527_c202412181021100.nc
NUCAPS-EDR_v3r2_j01_s202412180937549_e202412180938247_c202412181022030.nc
NUCAPS-EDR_v3r2_j01_s202412180938269_e202412180938567_c202412181021170.nc
NUCAPS-EDR_v3r2_j01_s202412180938589_e202412180939287_c202412181022310.nc
NUCAPS-EDR_v3r2_j01_s202412180939309_e202412180940007_c202412181021180.nc
NUCAPS-EDR_v3r2_j01_s202412180940029_e202412180940327_c202412181021580.nc
NUCAPS-EDR_v3r2_j01_s202412180940349_e202412180941047_c202412181023480.nc
NUCAPS-EDR_v3r2_j01_s202412180941069_e202412180941367_c202412181023040.nc
NUCAPS-EDR_v3r2_j01_s202412180941389_e202412180942087_c202412181023430.nc
NUCAPS-EDR_v3r2_j01_s202412180942109_e202412180942407_c202412181023470.nc
NUCAPS-EDR_v3r2_j01_s202412180942429_e202412180943127_c202412181023120.nc
NUCAPS-EDR_v3r2_j01_s202412180943149_e202412180943447_c202412181023480.nc
(base) [scottl@machine NUCAPSData]$
The variables that can be displayed using polar2grid and those files is quite long. If you were to download the files, and run the following command: ./polar2grid.sh -r nucaps -w geotiff --list-products-all -f /path_to_files/NUCAPS*.nc , you would see the many possibilities. For this blog post, I’m choosing Temperature_802mb and Temperature_596mb.
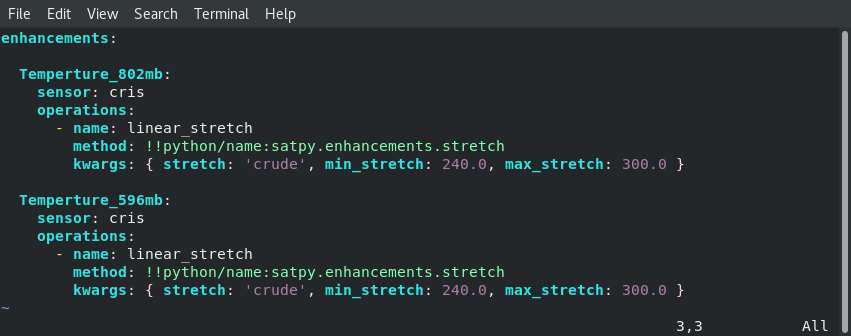
By default, polar2grid will rescale the plotted temperatures based on the range it finds. I want to have the same scale used for both levels here, and to do that, I have to tell polar2grid. This is done by adding a cris.yaml file into the directory polar2grid_v_3_1/etc/polar2grid/enhancements/, which directory is created as part of the polar2grid install process. The contents of the cris.yaml file that I created are below. I’ve mandated that both 802-mb temperatures and 596-mb temperatures be scaled from 240 to 300 K.
I also want to display these data on a map of my choosing (rather than the native NOAA-20 orbital map). Polar2grid allows a user to define a map with the p2g_grid_helper.sh shell script below; the script expects a grid name (CANucaps), a center longitude and latitude (115 W, 35 N), grid spacings in m (4000/-4000) and grid sizes (960×720). The output here is put into a yaml file.
./p2g_grid_helper.sh CANucaps -115.0 35.0 4000 -4000 960 720 > CANucaps.yaml
Next, I call polar2grid to make imagery, color-enhance it, and add coastlines and a colorbar, shown below.
../polar2grid.sh -r nucaps -w geotiff -p Temperature_802mb Temperature_596mb -g CANucaps --grid-configs ./CANucaps.yaml -f /path_to_NUCAPSData/*
./add_colormap.sh ../../colormaps/p2g_sst_palette.txt j01_atms-cris_Temperature_802mb_20241218_093722_CANucaps.tif
./add_colormap.sh ../../colormaps/p2g_sst_palette.txt j01_atms-cris_Temperature_596mb_20241218_093722_CANucaps.tif
./add_coastlines.sh --add-coastlines --add-colorbar --colorbar-text-size 16 j01_atms-cris_Temperature_802mb_20241218_093722_CANucaps.tif
./add_coastlines.sh --add-coastlines --add-colorbar --colorbar-text-size 16 j01_atms-cris_Temperature_596mb_20241218_093722_CANucaps.tif
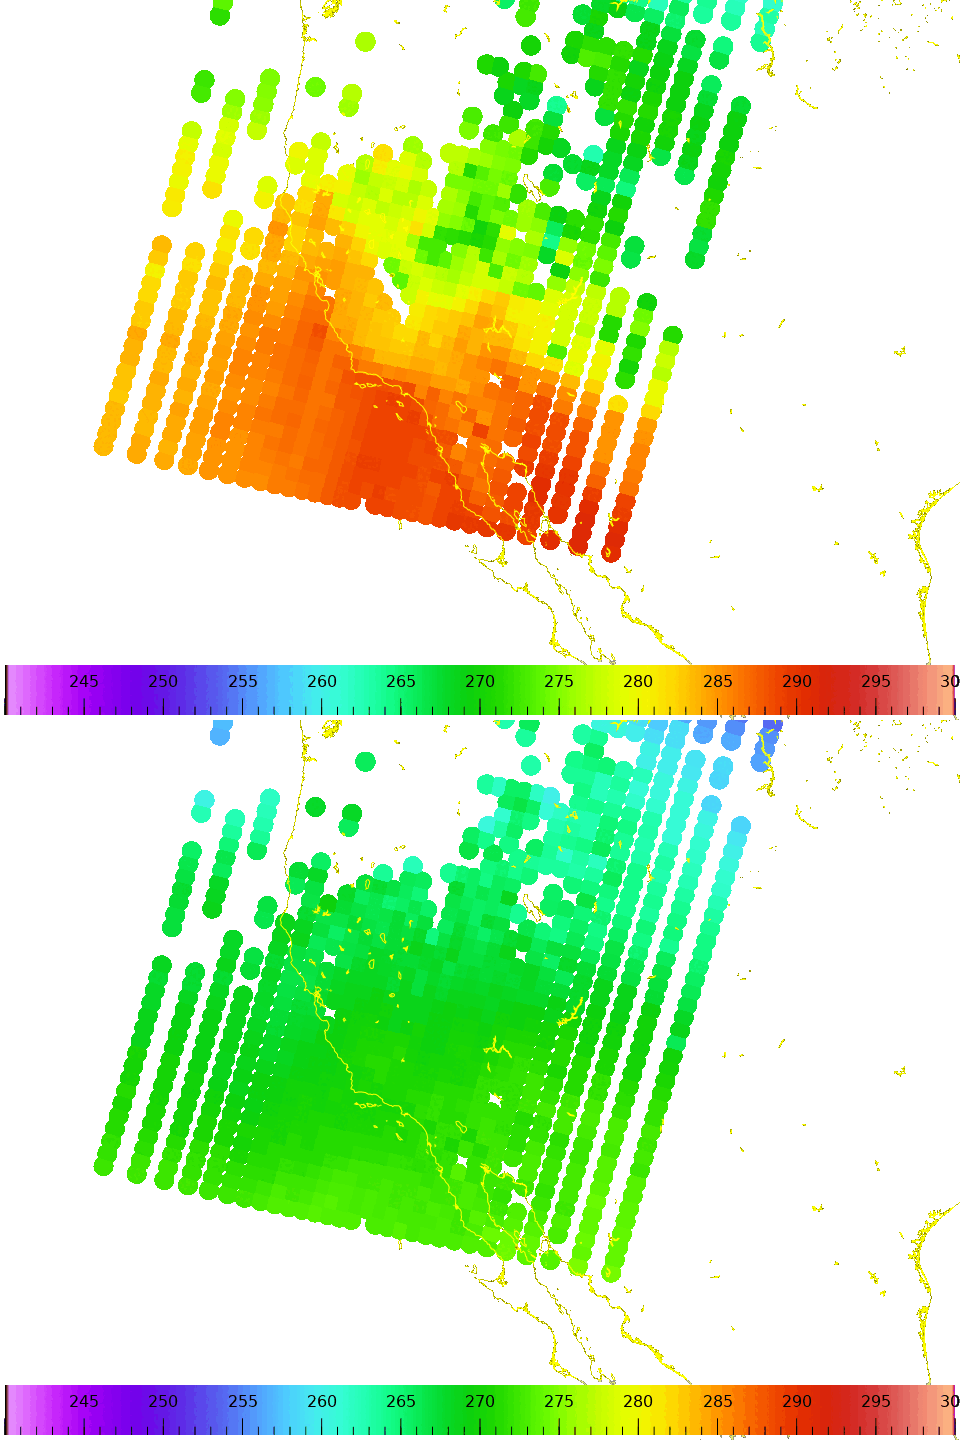
The resultant imagery is shown in a toggle below. I didn’t label the imagery, but I hope you can tell which field is 802mb, and which is 596mb! The colorbar automatically scales to the values specified in the cris.yaml file.
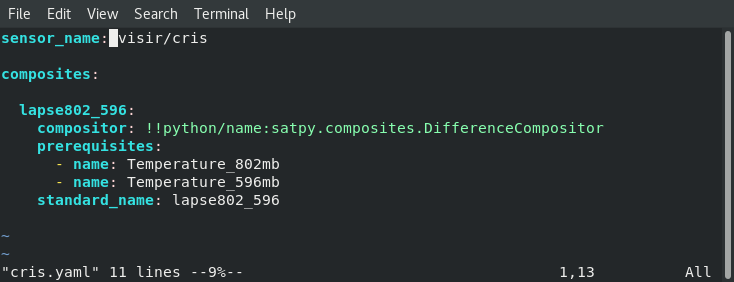
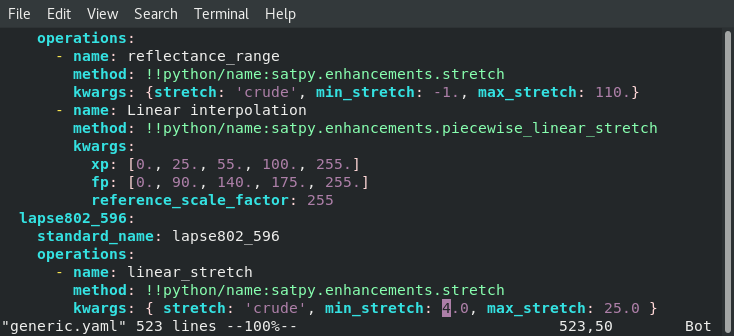
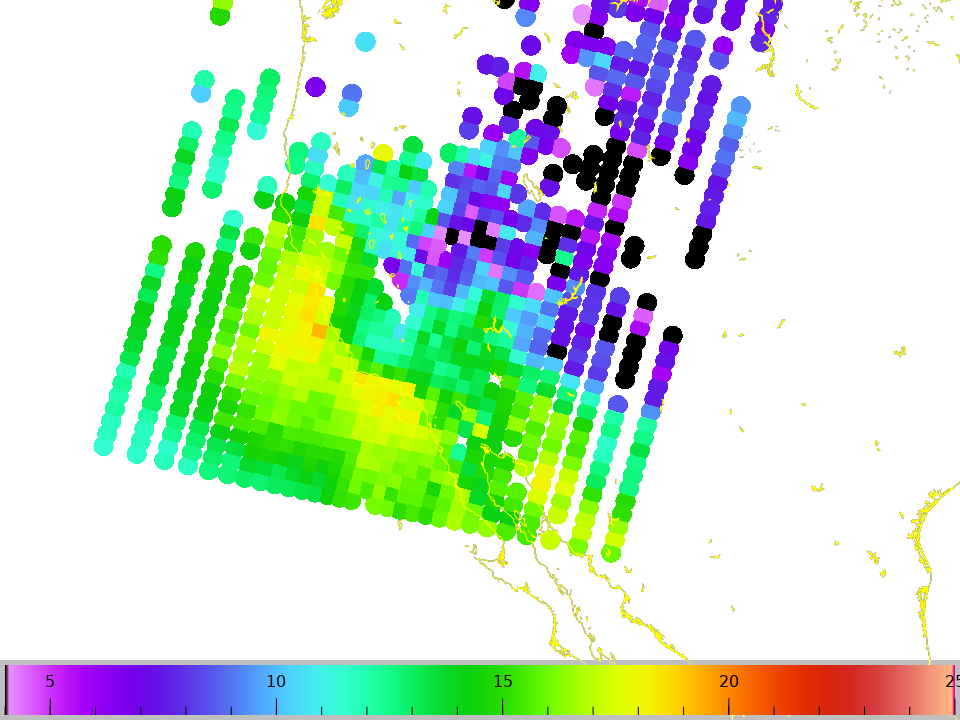
Next, I decided I wanted to compute and plot the temperature difference between 802 and 596 mb. That requires additions to two files within the polar2grid distribution. A cris.yaml file is needed in (polar2grid_v_3_1/etc/polar2grid/composites/), with contents as shown below. I defined the parameter (lapse802_596) as using the DifferenceCompositor that requires two fields. Then, in the enhancements directory (polar2grid_v_3_1/etc/polar2grid/enhancements/) I scaled the field to be between 4 and 25K.
If I ran polar2grid now, and pointed to the NUCAPS data directory, and asked it to –list-products-all — I would see a new possibility! lapse802_596. The three polar2grid calls below,
./polar2grid.sh -r nucaps -w geotiff -p lapse802_596 -g CANucaps –grid-config ./CANucaps.yaml -f /path_to_NUCAPSData/*
./add_colormap.sh ../../colormaps/p2g_sst_palette.txt j01_atms-cris_lapse802_596_20241218_093722_CANucaps.tif
./add_coastlines.sh –add-coastlines –add-colorbar –colorbar-text-size 16 j01_atms-cris_lapse802_596_20241218_093722_CANucaps.tif
The result of those three calls is shown below. The steepest lapse rates are off the coast of California and in northwestern Mexico.
Thanks to Dave Hoese, CIMSS, for helping me figure this out!
—————
Free Secure Email – Transcom Sigma
Transcom Hosting
Transcom Premium Domains
