Using an augmented Hydra within McIDAS-V to view CrIS fields
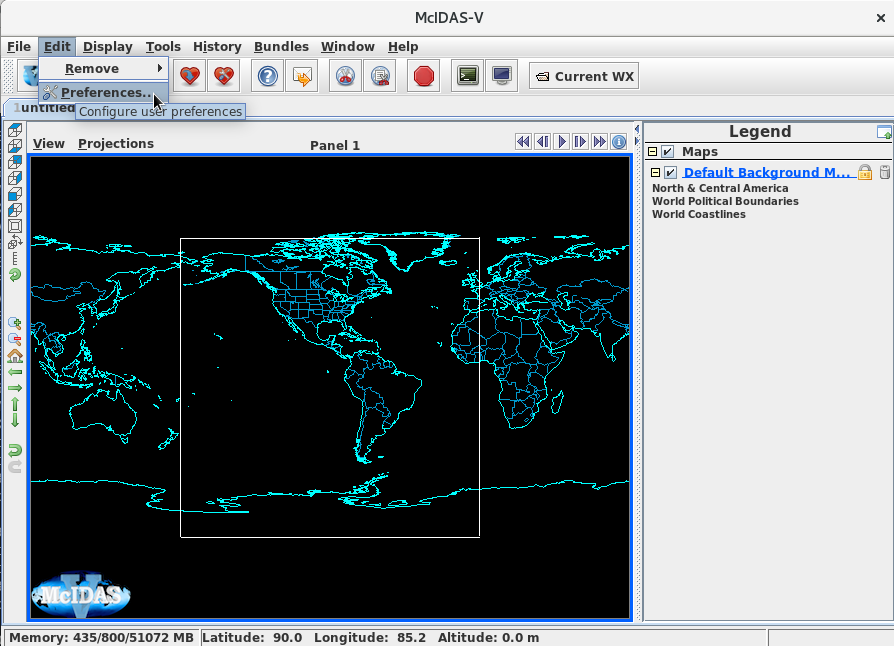
Scientists and programmers at SSEC/CIMSS have been working with Hydra within McIDAS-V to augment its functionality, enabling it to view data from the Cross-Track Infrared Sounder (CrIS) on JPSS Satellites (Suomi-NPP, NOAA-20 and NOAA-21). How is this functionality accessed? After downloading the McIDAS-V package, and opening it, a user will need to configure User Preferences, as shown in the image below.
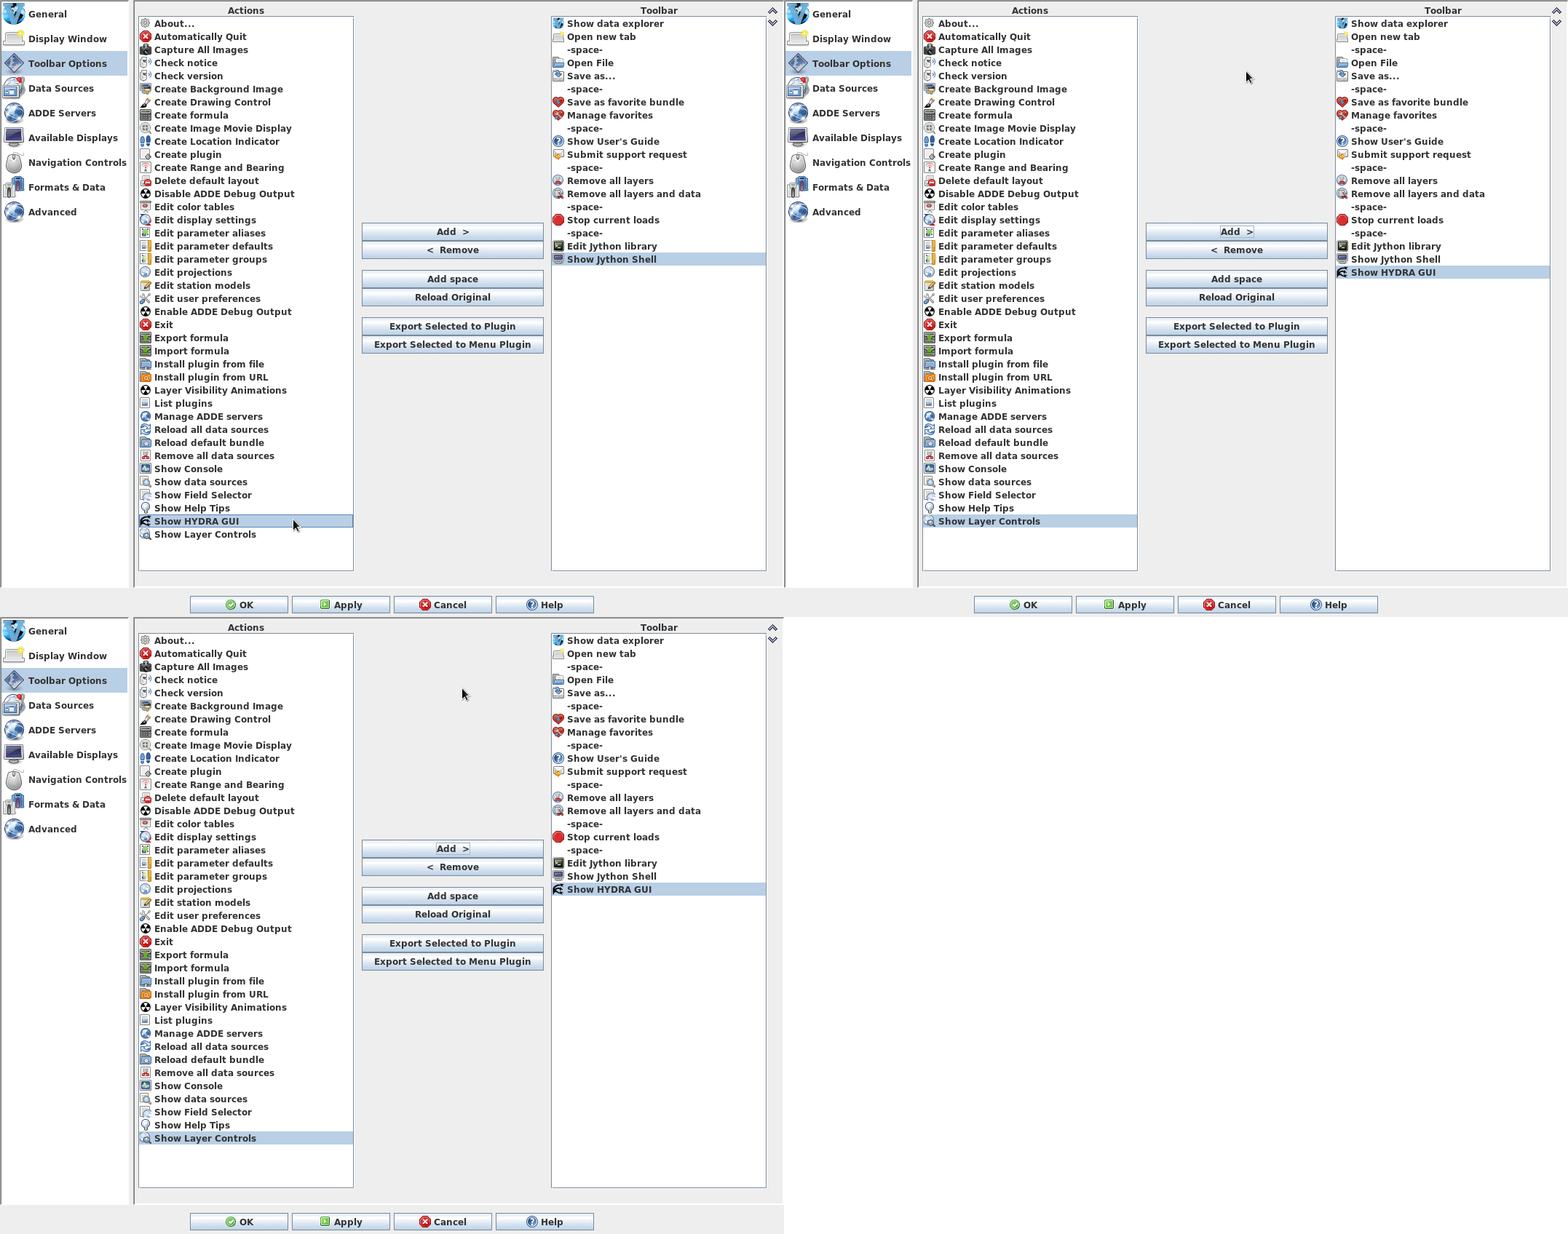
In the Preferences window, change the Toolbar Options so that ‘Show HYDRA GUI’ is included. That’s demonstrated in the toggle below. Highlight ‘Show HYDRA GUI’ on the left (under ‘Actions’), then click ‘Add’. Once this is done, as you’ll see below, there is a ‘Hydra’ GUI tab on the McIDAS-V front page, as shown here.
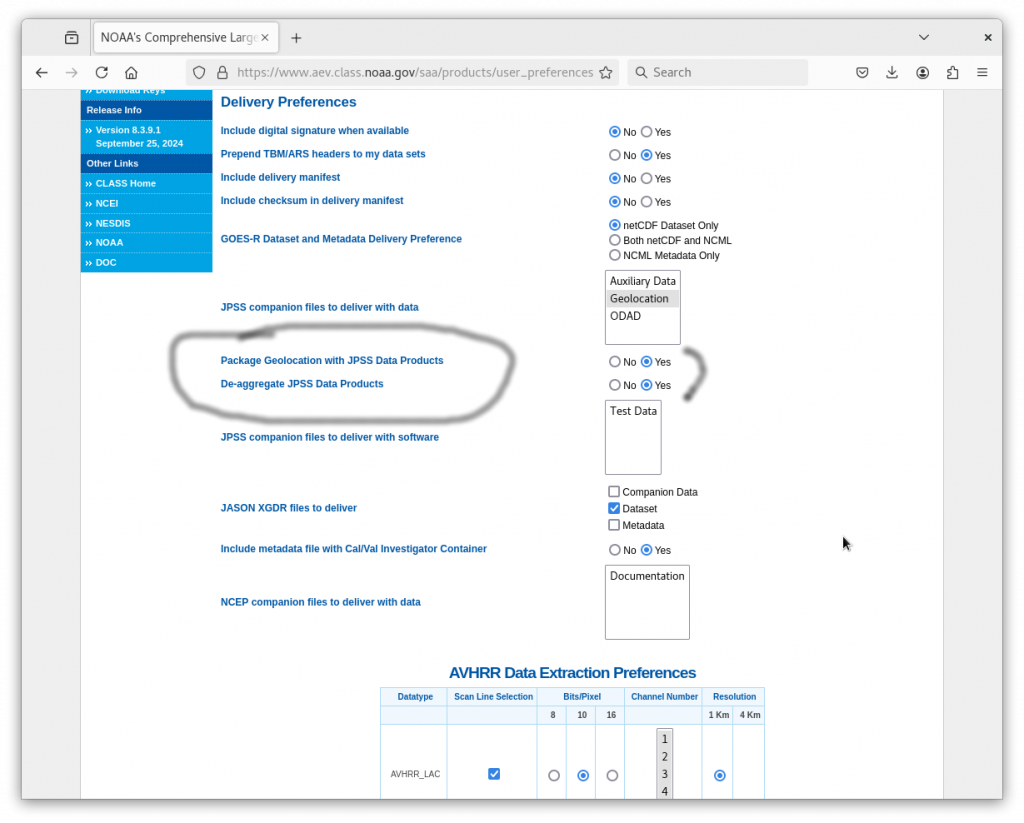
What kind of data are expected by the Hydra plug-in? You can order the data from NOAA’s CLASS System. At that website, before ordering, change the User Preferences, accessed from the left toolbar as shown below.

The User Preferences that Hydra expects are ‘Package Geolocation with JPSS Data Products’; Hydra needs this as ‘Yes’ because it expects data and geolocation data to be in the same file. Note that this is different from other software packages, such as Polar2Grid, that expect data files and geolocation files to be separate (albeit ultimately in the same directory). I did click ‘Yes’ on ‘Deaggregate JPSS Data Products’ but this did not appear to have an effect as I expected (which would be to put all granules in one file).
The data to order are shown here; under the ‘Please select a product to search’ drop-down menu, choose JPSS CrIS SDR Operational, (Note: SDR means Sensor Data Record) and either choose by times (I typically go to this website to find the series of times that I want) or location. For this example, I choose NOAA-20 data from 1240 to 1255 on 26 October 2024. (This website shows the swath from Greenland to the Aleutians). After ordering the data, you’ll get an email showing where the requested data are stored, as shown here. The file names at that include many granules. The file name structure shown below includes both the Geolocation information (‘GRCSO’) and the CRiS data (‘SCRIF’), as shown below. If you hadn’t specified ‘Package Geolocation with JPSS Data Products‘ under User Preferences, NOAA CLASS would return individual SCRIF and GCRSO files the Hydra (today) cannot interpret correctly.

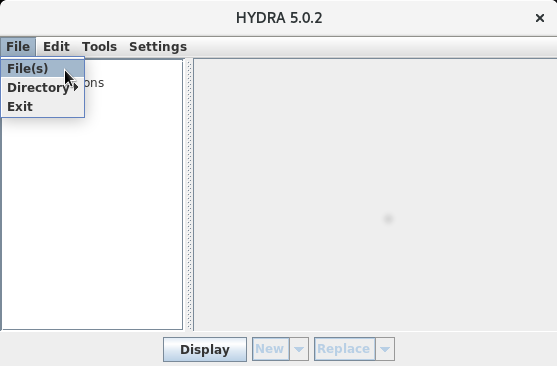
Put all the files specified in the email into a local directory. You’re now ready to display them using Hydra, so click the Hydra icon in the McV window. When you do that, you’ll see the window appear (below) from which you can point to the directory where the data sits by selecting ‘File(s)’ under the ‘File’ tab.
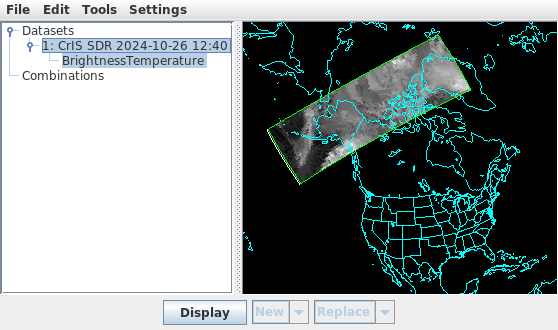
After selecting all the files within the directory into which I placed the GCRSO-SCRIF files, and clicking ‘Open’, the Hydra window changed. Note that the swath of data overlays what you might have expected given the swath from the SSEC Polar Orbit Track website. Once the swath appears, click on ‘Display’ in this window.
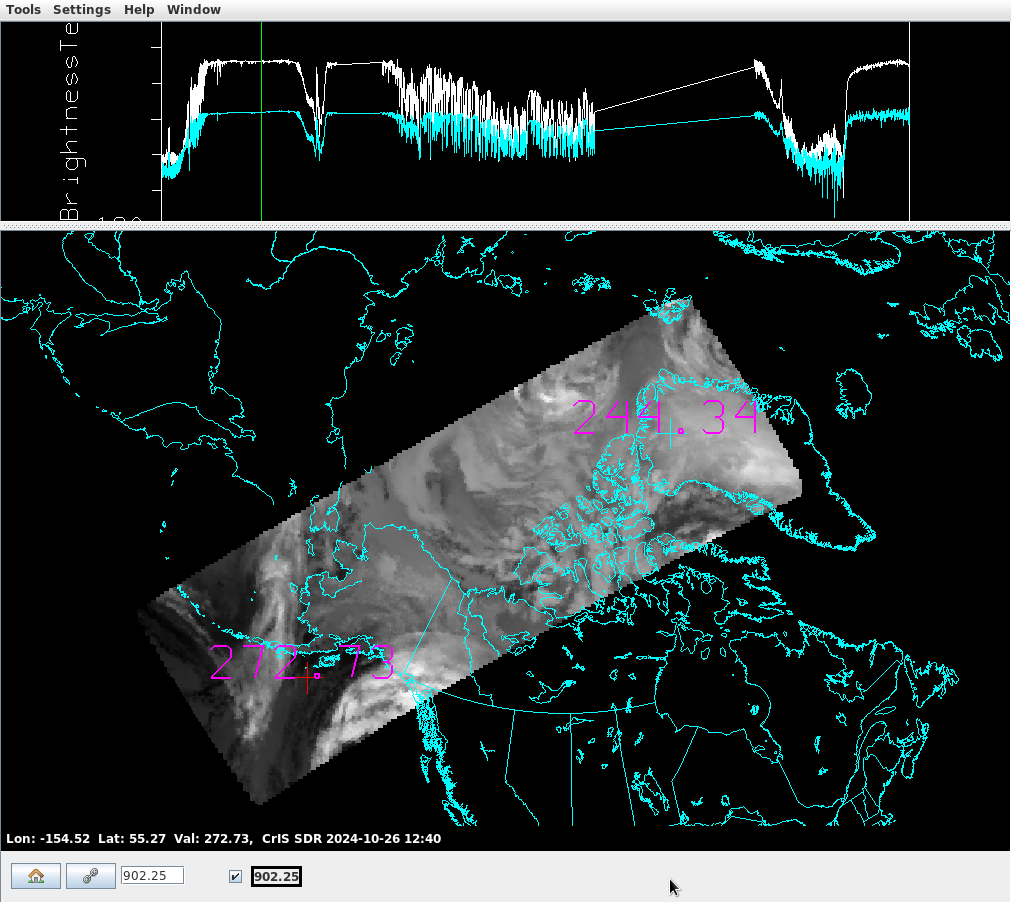
‘Display’ will open another window that shows two probes and the swath. I moved the probe values, and resized the window, and the result is below. The CrIS spectra at the two points are shown — and you can drag the probe locations around the image and see how the spectra change in real time. In this case, the ‘warmer’ (‘cooler’) location’s spectrum is shown in white (cyan). The data in the lower image are CrIS data at wavenumber 902.25 (that is, 11.1 micrometers). That can be changed either by dragging the green line or by entering a value in the box at the bottom of the window.
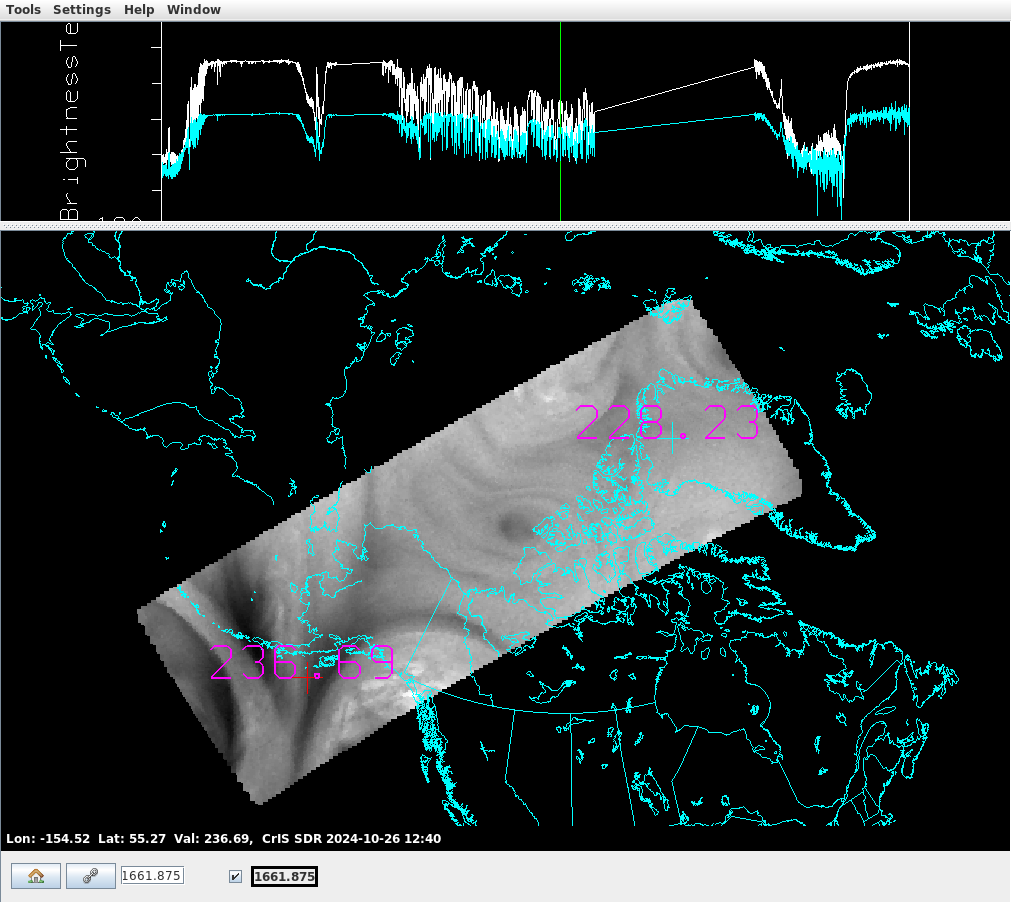
The window below shows how things change when the green line is dragged to the right, and released. Wavenumber 1661.875 (that is, 6.02 micrometers) is shown in the large window now.
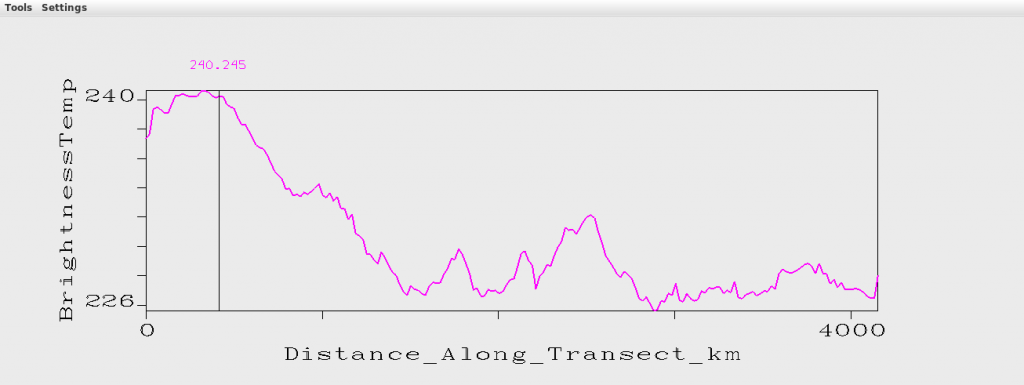
Now, under Tools there is a ‘Transect’ choice. If you choose that, a solid line will appear in the window, as shown below. I’ve moved it so it’s start/end points coincide with the two probe locations, and that is shown below.
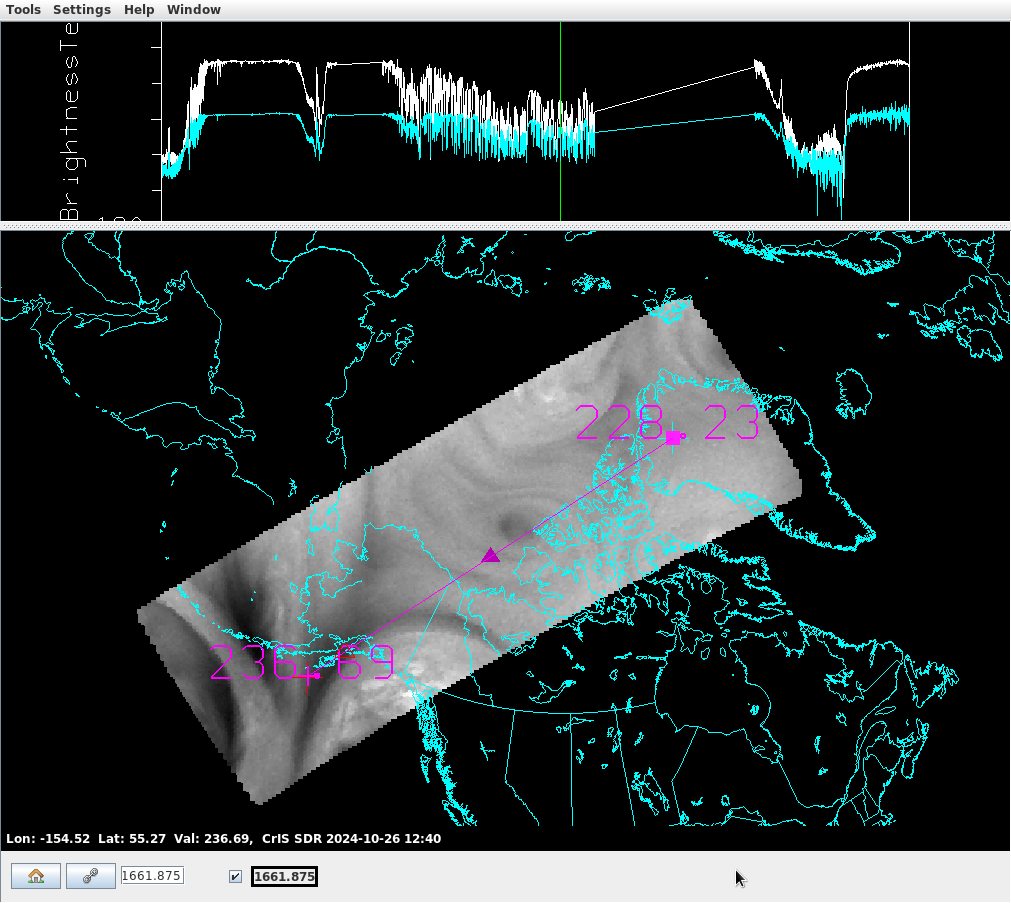
The Wavenumber 1661.875 Brightness temperatures along that line are shown below. If you drag the endpoints of the transect line above, the transect displayed below will change in real time. If you click on that solid triangle in the center of the transect, you can drag the entire line, and you’ll also see the transect below changing in real time.
Other functionality available includes the creation of RGB imagery from CrIS data, and the creation scatterplots (and density plots) that compare two different channels on CrIS. Becoming familiar with wavenumber spectra is an important process given that a geostationary atmospheric sounder (GXS) is scheduled to fly on GeoXO, scheduled for launch in the mid-2030s. The version of McIDAS-V that includes the functionality described herein is available at the Daily Build link here. This daily build is created every day with all of the previous day’s programming changes. Therefore, not everything has been fully tested. If you are prompted for a user/password: ‘mcv’ will work for both.
I am indebted to Bob Carp, SSEC, for his help in understanding the functionality of this software. Thanks are also due to Bill Line, CIRA, for asking for (and funding!) this expansion in functionality.
—————
Free Secure Email – Transcom Sigma
Transcom Hosting
Transcom Premium Domains
