
The North American Total Eclipse of April 2024
Contributors: Scott Bachmeier, Mat Gunshor, Rick Kohrs, Margaret Mooney, Jim Nelson, Tim Schmit, and Eric Verbeten.
The animation above (here) will auto-update about every 20 minutes.
The eclipse starts in the GOES-West footprint, as shown above (Here’s a link to a Full-Disk GOES-West animation). By 1700 UTC, however, GOES-East starts to view it, as shown below (Here’s a link to a Full-Disk GOES-East animation).
Here are CIMSS Natural Color animations from GOES-West and GOES-East Full Disk showing the eclipse shadow.
To examine the effects of the eclipse shadow on surface weather, let’s turn to GOES-16 Near-Infrared “Vegetation” images (below), centered over North Texas. Many sites recorded drops in surface air temperature of 4-5 degrees F as the shadow traversed the area.
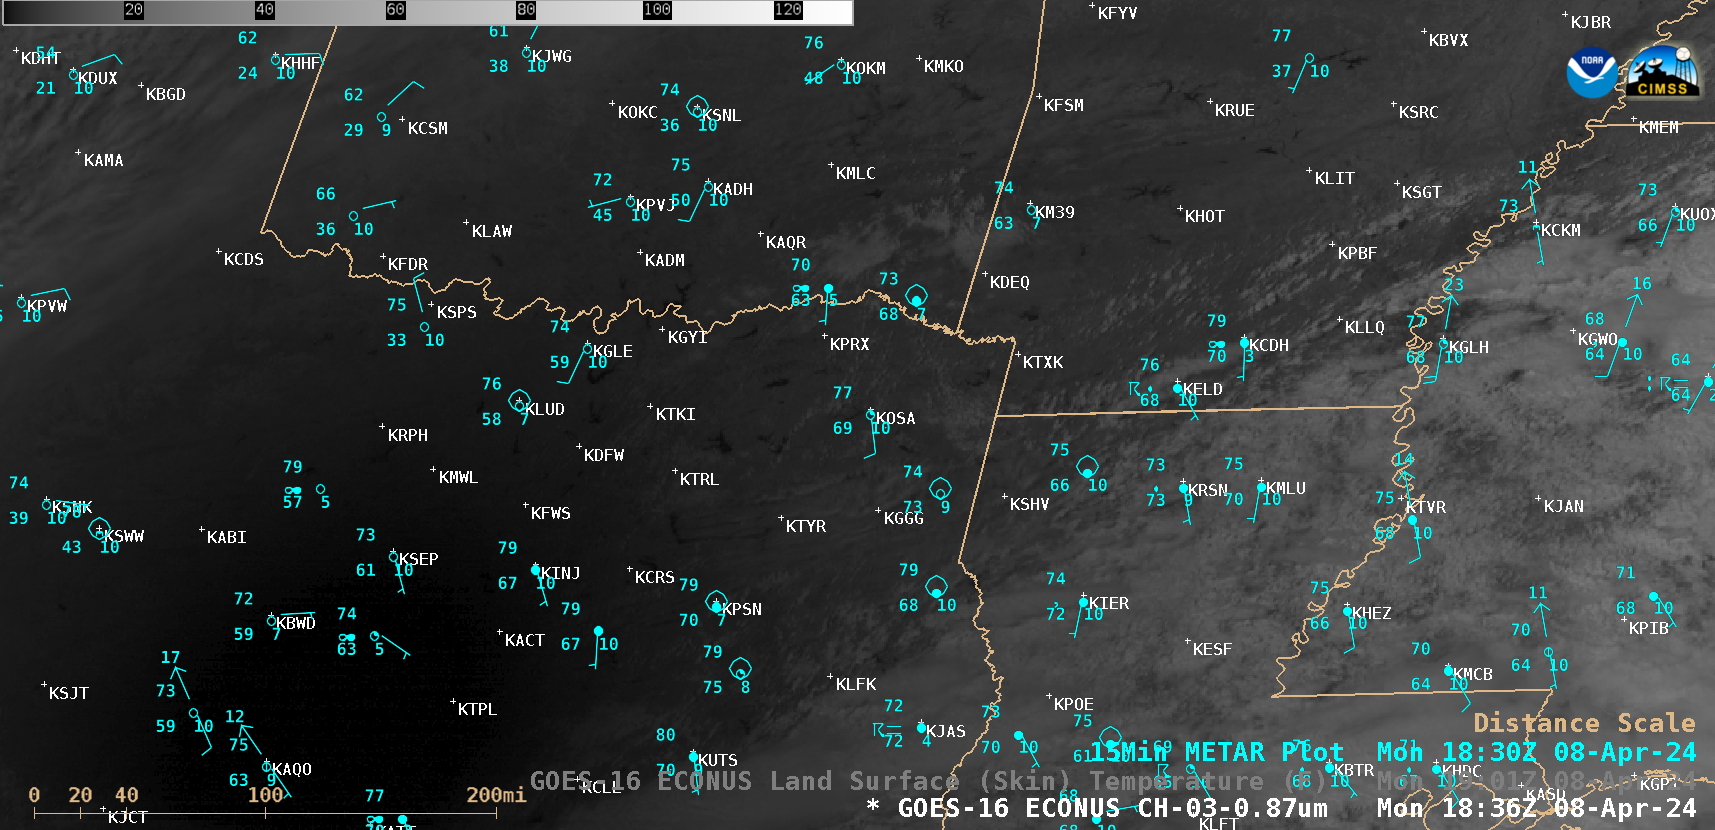
GOES-16 Near-Infrared “Vegetation” images with plots of surface reports, from 1701-2001 UTC (courtesy Scott Bachmeier CIMSS) [click to play animated GIF | MP4]
The corresponding hourly GOES-16 Land Surface Temperature (LST) derived product (below) displayed cooling LSTs as the shadow’s arrival halted the trend of midday heating.
GOES-16 Land Surface Temperature derived product, from 1701-1901 UTC (courtesy Scott Bachmeier, CIMSS) [click to enlarge]
The eclipse shadow and its effect on surface cooling was also evident in imagery from polar-orbiting satellites. 3 consecutive overpasses of NOAA-20 and Suomi-NPP provided VIIRS False Color RGB and Shortwave Infrared images centered over northwest Arkansas (below) — which showed a notable cooling of surface infrared brightness temperatures across the Mississippi Alluvial Plain as the shadow moved across the region. In addition, a number of METAR sites reported surface air temperature drops of 5-6 degrees F as incoming solar radiation decreased.
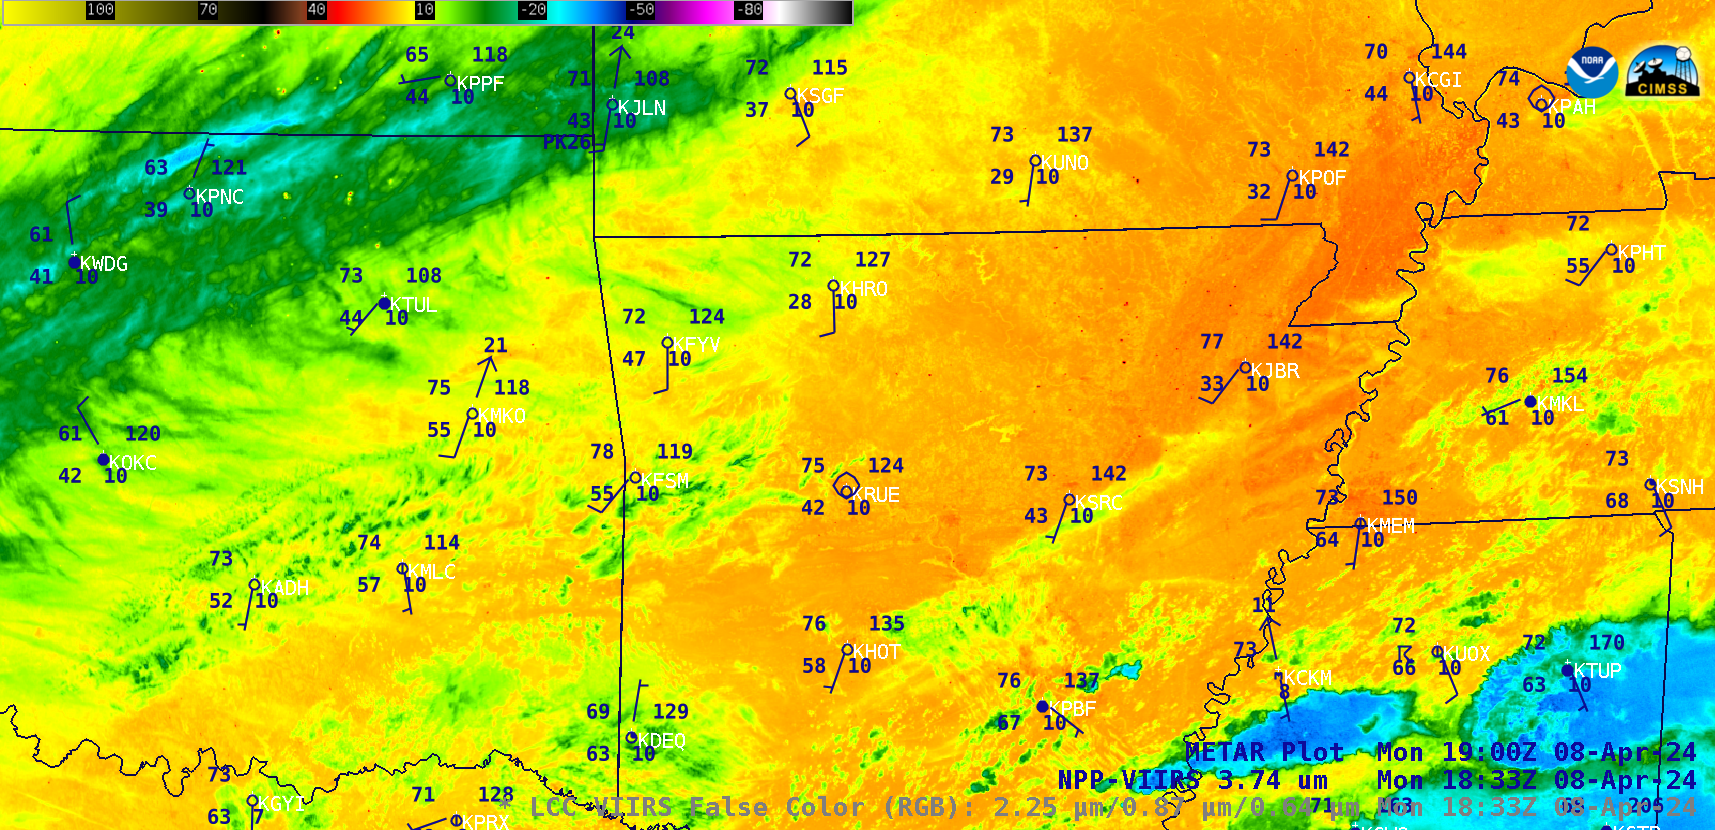
Sequence of 3 VIIRS False Color RGB and Shortwave Infrared images from NOAA-20 and Suomi-NPP, with plots of surface reports (courtesy Scott Bachmeier, CIMSS) [click to play animated GIF | MP4]
_____________________________________
Early on 8 April (CSPP Geosphere link also shown below), there are some obvious winners and losers as far as Eclipse-viewing goes, as shown with GOES imagery. If you’re in western New York State, for example, things look unfortunate. Texas? Hit or miss: plenty of clouds, but not completely overcast. Maine? That looks pretty good to this blogger! We’ll see how things evolve during the day however. Here in Madison WI, skies look like a view of a 90%-eclipsed sun is likely. Check out the CSPP Geosphere site for the latest imagery.
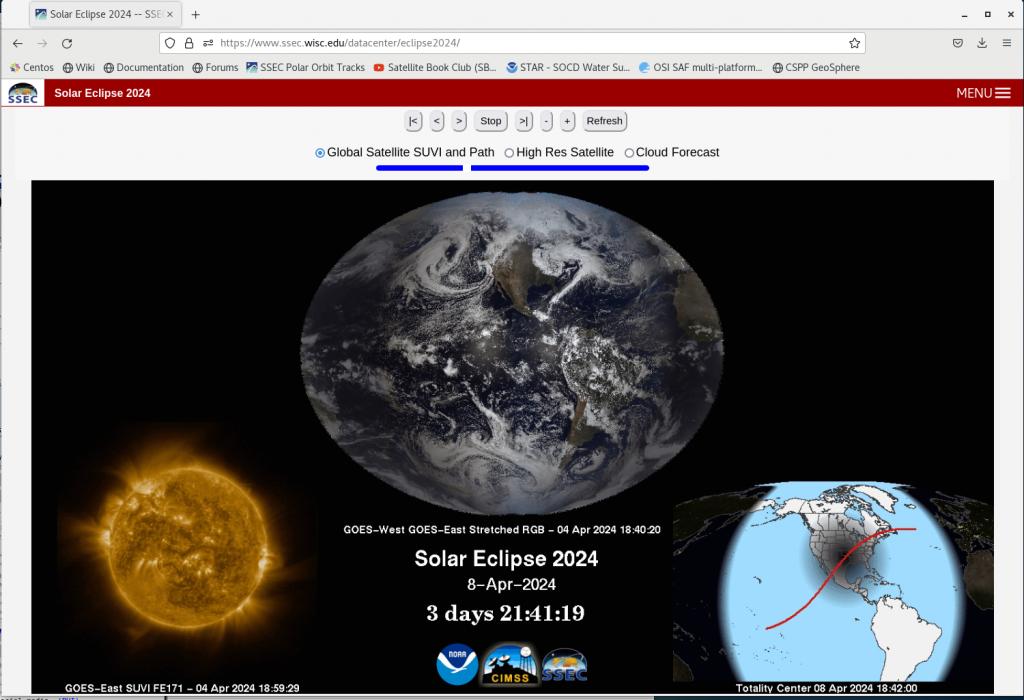
Real-time animations of the Eclipse will be available at the website shown above, https://www.ssec.wisc.edu/datacenter/eclipse2024/ . Animations will include ABI and SUVI data.
Just seven years after a total eclipse swept northwest to southeast across the Contiguous United States (as discussed in blog posts here and here), a total solar eclipse will move southwest to northeast from Mexico to the eastern Great Lakes to New England on 8 April 2024. During and after the event, we will post an animation (above) with combined views from GOES-18 and GOES-16 showing the satellite view of the Moon’s shadow. There will also possibly be mesoscale sectors covering the path of the eclipse (link).
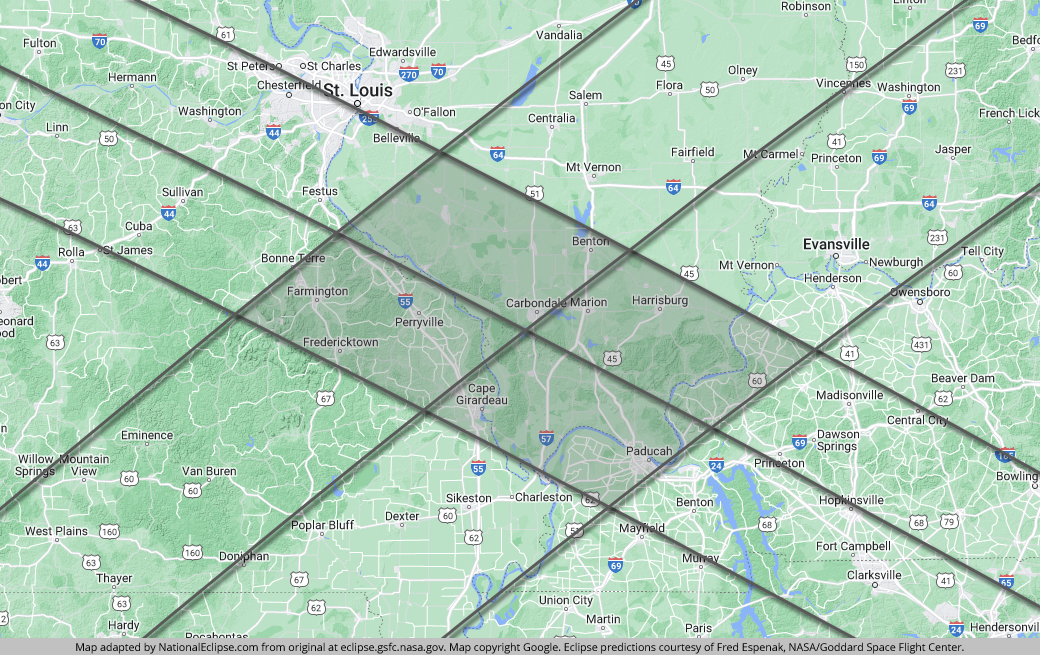
The paths of the 2017 eclipse and the 2024 eclipse are shown below. (Shout out to those Americans who had the foresight to live in the intersecting paths of totality near Carbondale IL as shown in the figure below the two globes, from this handy website).
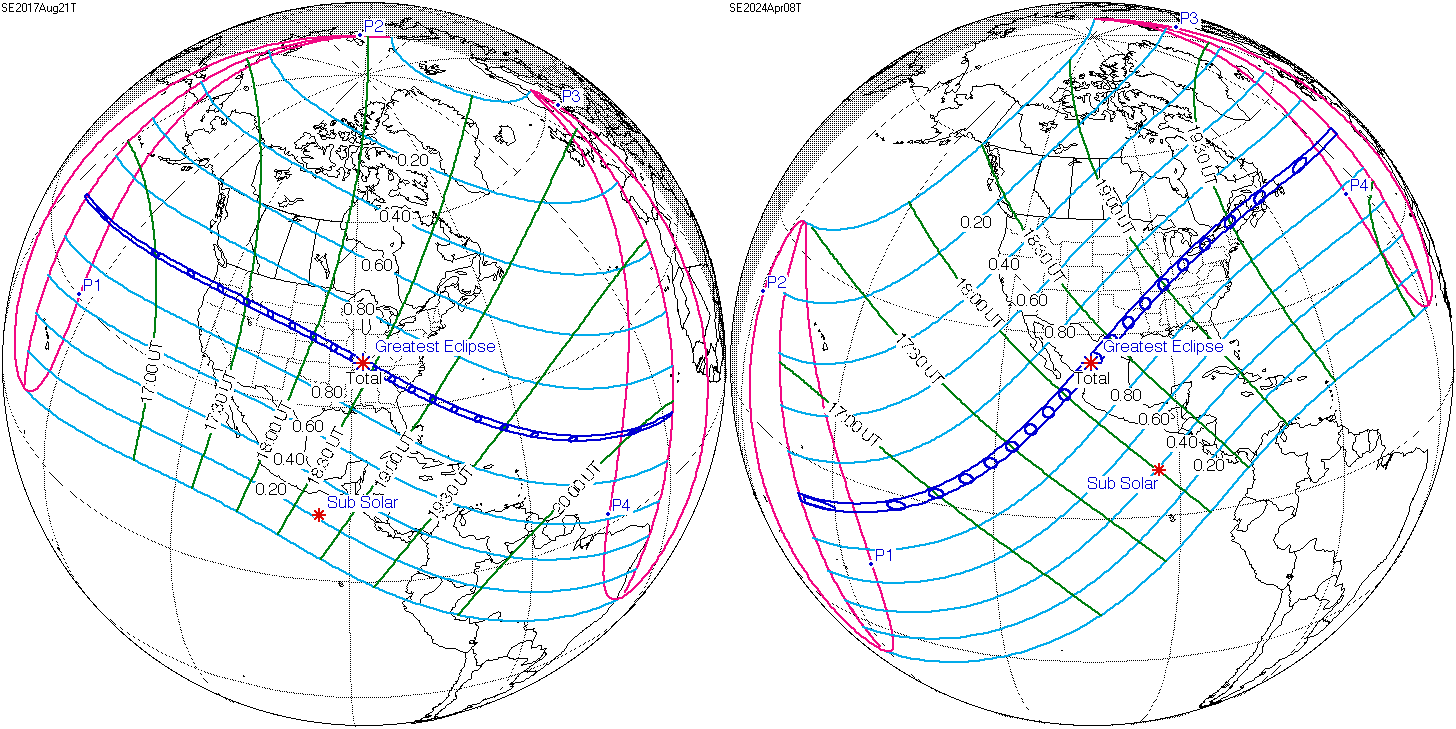
The animation below (from Rick Kohrs, SSEC/CIMSS), shows the region of the shadow as it moves across North American and adjacent waters, from sunrise over the Equatorial Pacific to sunset over the north Atlantic. (The same animation with a stationary map is here).
—————
Free Secure Email – Transcom Sigma
Transcom Hosting
Transcom Premium Domains