
Smokehouse Creek fire in north Texas
The Smokehouse Creek fire (inciweb link) as of sunrise 28 February is the 2nd largest fire in Texas history. VIIRS True-Color imagery above shows an extensive smoke plume (and a lot of other clouds!) over the eastern part of the north Texas Panhandle between 1830 and 2015 UTC on 27 February. Surface observations show very strong gusts from the west. In addition, a wind shift/cold front is moving southward into the domain by 2015 UTC, denoted by a line of cumulus cloud, with strong northerly winds behind it.
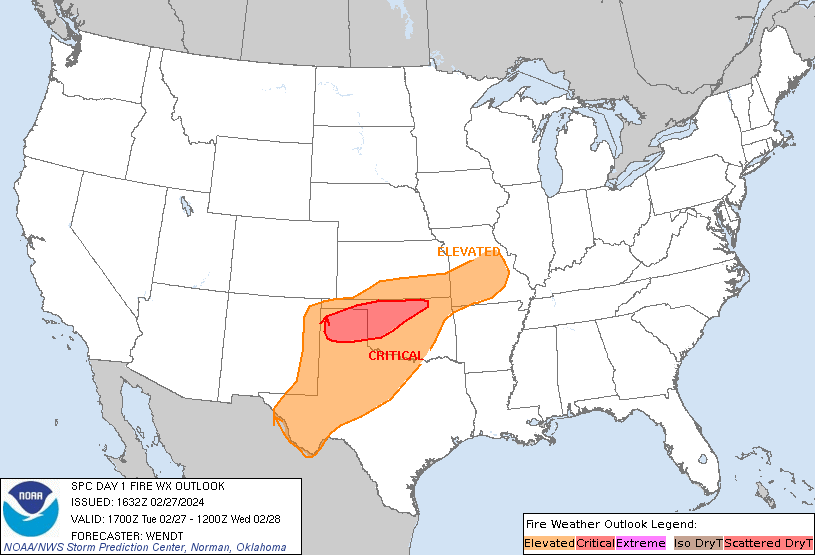
SPC’s fire weather outlook had parts of the north Texas panhandle in a critical fire weather outlook as shown below, especially because of strong wind gusts. The NWS in Lubbock has a fuel dryness image (the image for 27 February is here) and that shows the fire initiated in a region that was dry to critically dry. NWS Lubbock also has composite image for fire days (link). 27 February matches well.
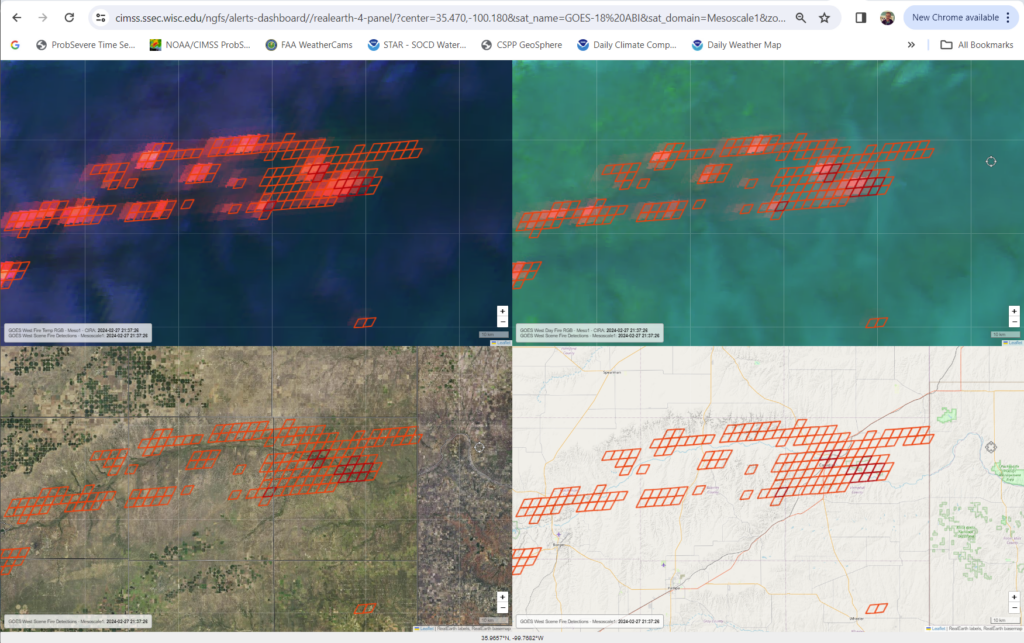
The Next Generation Fire Service (NGFS) has various imagery to help describe the current fire and its environment. For example, the imagery above from 2137 UTC on 27 February 2024, includes Fire Temperature RGB imagery (upper left), Day Fire RGB (upper right), GOES-West fire detection pixels (on top of True-color imagery, bottom left, and on top of a map, bottom right). This event included a large number of fire pixels detected, especially around the city of Canadian TX.
The animation of Fire Temperature RGB, below, from AWIPS, shows the evolution of the ongoing fire, and its interaction with a southward-moving cold front; when the front moves through the regions with fire (for example, near 2200 UTC in Canadian TX), the propagation of the fire switches from west-to-east to northwest-to-southeast. Satellite detection of the active fire is challenged at the end of the animation below because of increasingly thick upper-level clouds moving in from the southwest.
Night Microphysics RGB imagery, below, from the CSPP Geosphere site, show thick clouds over the fire region initially; by the end of the animation, however, hot spots in the Night Microphysics RGB (pixels that are magenta/pink) start to emerge.
VIIRS imagery from 28 February 2024, below, defines the large outline of the burnscar. The scar in the visible (0.64 µm) imagery is not quite so distinct as it is in 0.87 µm and 1.61 µm. The 3.74 µm (shortwave infrared) suggests that burning is continuing on 28 February. The False Color imagery uses information from the 1.61 µm and 0.87 µm bands. The burn scar is extensive, covering almost the entirety of several Texas counties!
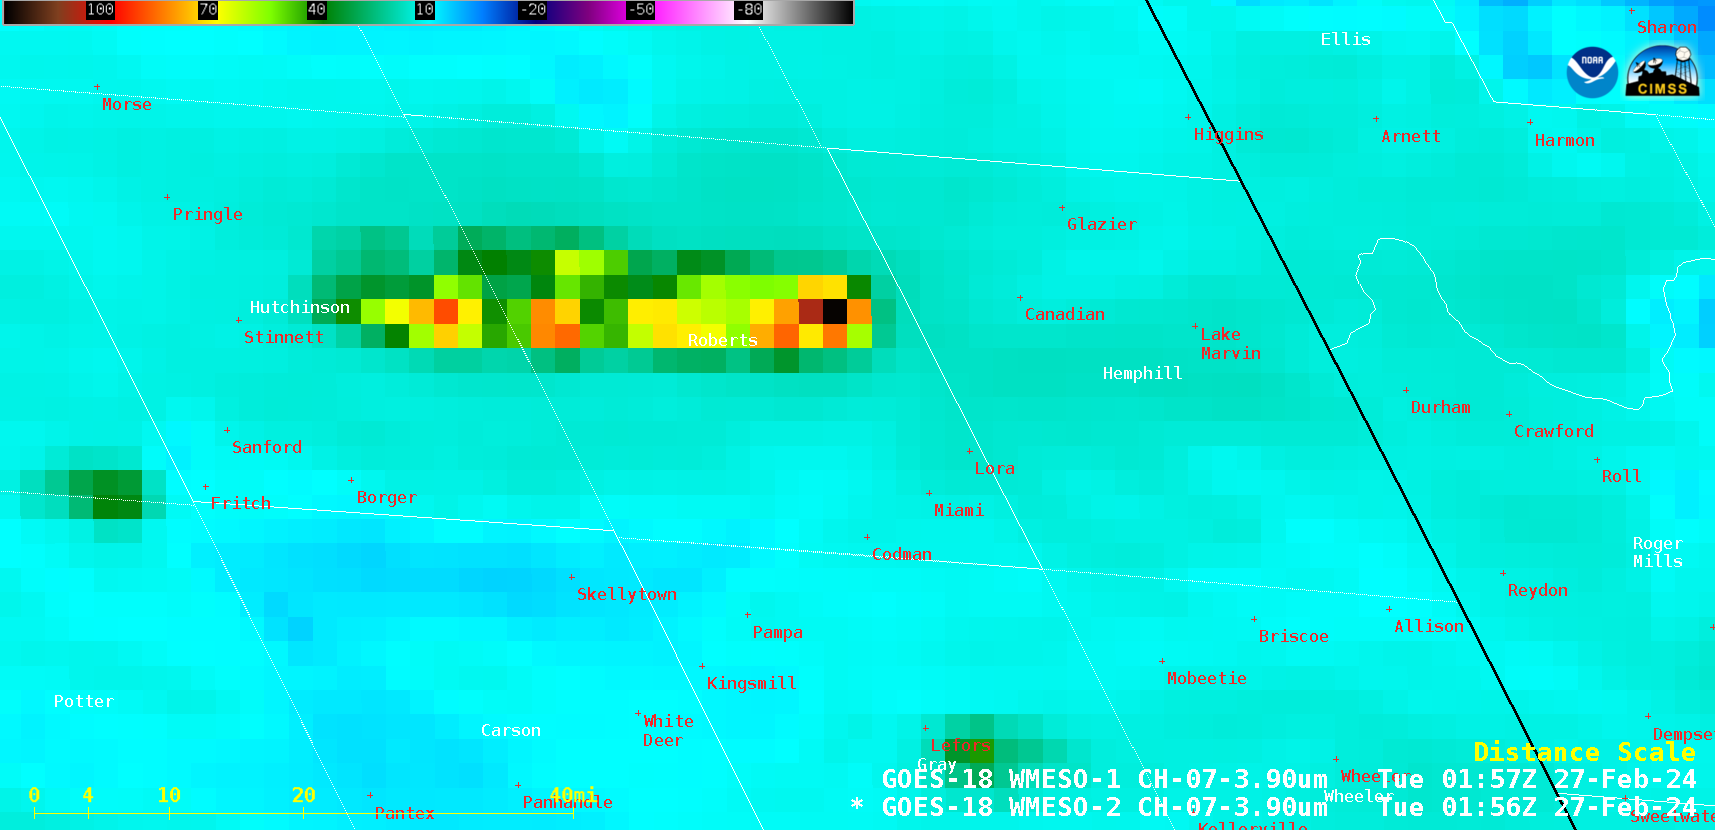
1-minute GOES-18 Shortwave Infrared (3.9 µm) images from 1855 UTC on 26 February to 0159 UTC on 27 February (courtesy Scott Bachmeier, CIMSS) [click to play animated GIF | MP4]
1-minute Mesoscale Domain Sector GOES-18 (GOES-West) Shortwave Infrared (3.9 µm) images (above) showed the rapid eastward run of the Smokehouse Creek Fire during its first 7 hours on 26 February — covering a distance of about 40 miles across Hutchinson and Roberts counties in the Texas Panhandle. Although the InciWeb report listed the fire origin time as 14:20 CST (2020 UTC), the first unambiguous thermal anomaly in the GOES-18 Shortwave Infrared imagery was at 1857 UTC.
The Smokehouse Creek Fire burned very hot, exhibiting a maximum 3.9 µm infrared brightness temperature of 137.88ºC (which is the saturation temperature of the GOES-18 ABI Band 7 detectors) as early as 2104 UTC (below).
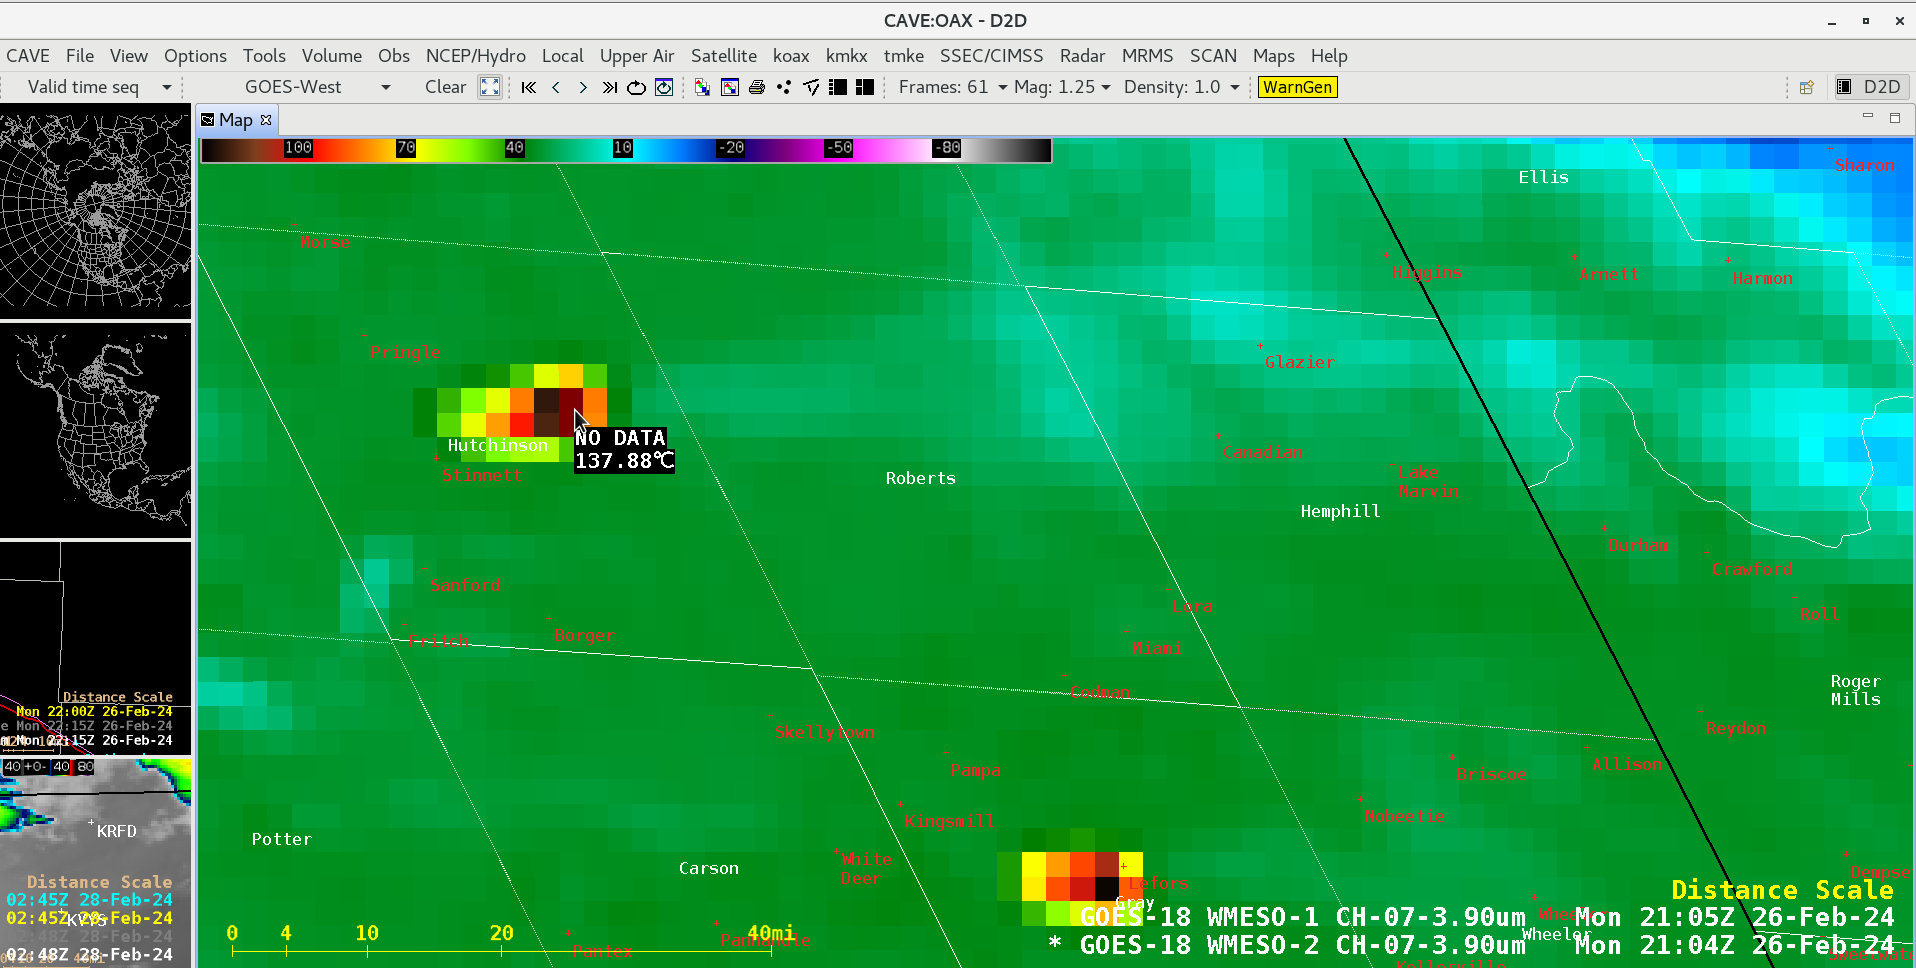
Cursor sample of GOES-18 Shortwave Infrared (3.9 µm) brightness temperature at 2104 UTC on 26 February (courtesy Scott Bachmeier, CIMSS) [click to enlarge]
—————
Free Secure Email – Transcom Sigma
Transcom Hosting
Transcom Premium Domains