Severe thunderstorms across parts of Texas, Louisiana Mississippi and Alabama — with heavy rainfall and tornadoes in southern Louisiana

30-second (ending at 1200 UTC) and 1-minute GOES-16 “Clean” Infrared Window (10.3 µm) images from 1020-1725 UTC on 10 April, with time-matched (within +/- 3 minutes) SPC Storm Reports plotted in cyan [click to play animated GIF | MP4]
30-second (ending at 1200 UTC) and 1-minute Mesoscale Domain Sector GOES-16 “Clean” Infrared Window (10.3 µm) images (above) included plots of time-matched (within +/- 3 minutes) plots of SPC Storm Reports (09 April | 10 April) across parts of Texas, Louisiana, Mississippi and Alabama on 10 April 2024. The corresponding 1-minute GOES-16 “Red” Visible (0.64 µm) images after sunrise are shown below.

1-minute GOES-16 “Red” Visible (0.64 µm) images from 1201-1725 UTC on 10 April, with time-matched (within +/- 3 minutes) SPC Storm Reports plotted in red [click to play animated GIF | MP4]
One notable event that occurred during this period was heavy rainfall which produced flooding in the New Orleans, Louisiana area — 1-minute GOES-16 Infrared images (below) showed the clusters of thunderstorms responsible for precipitation accumulations that exceeded 1.0-2.0 inches per hour at times.
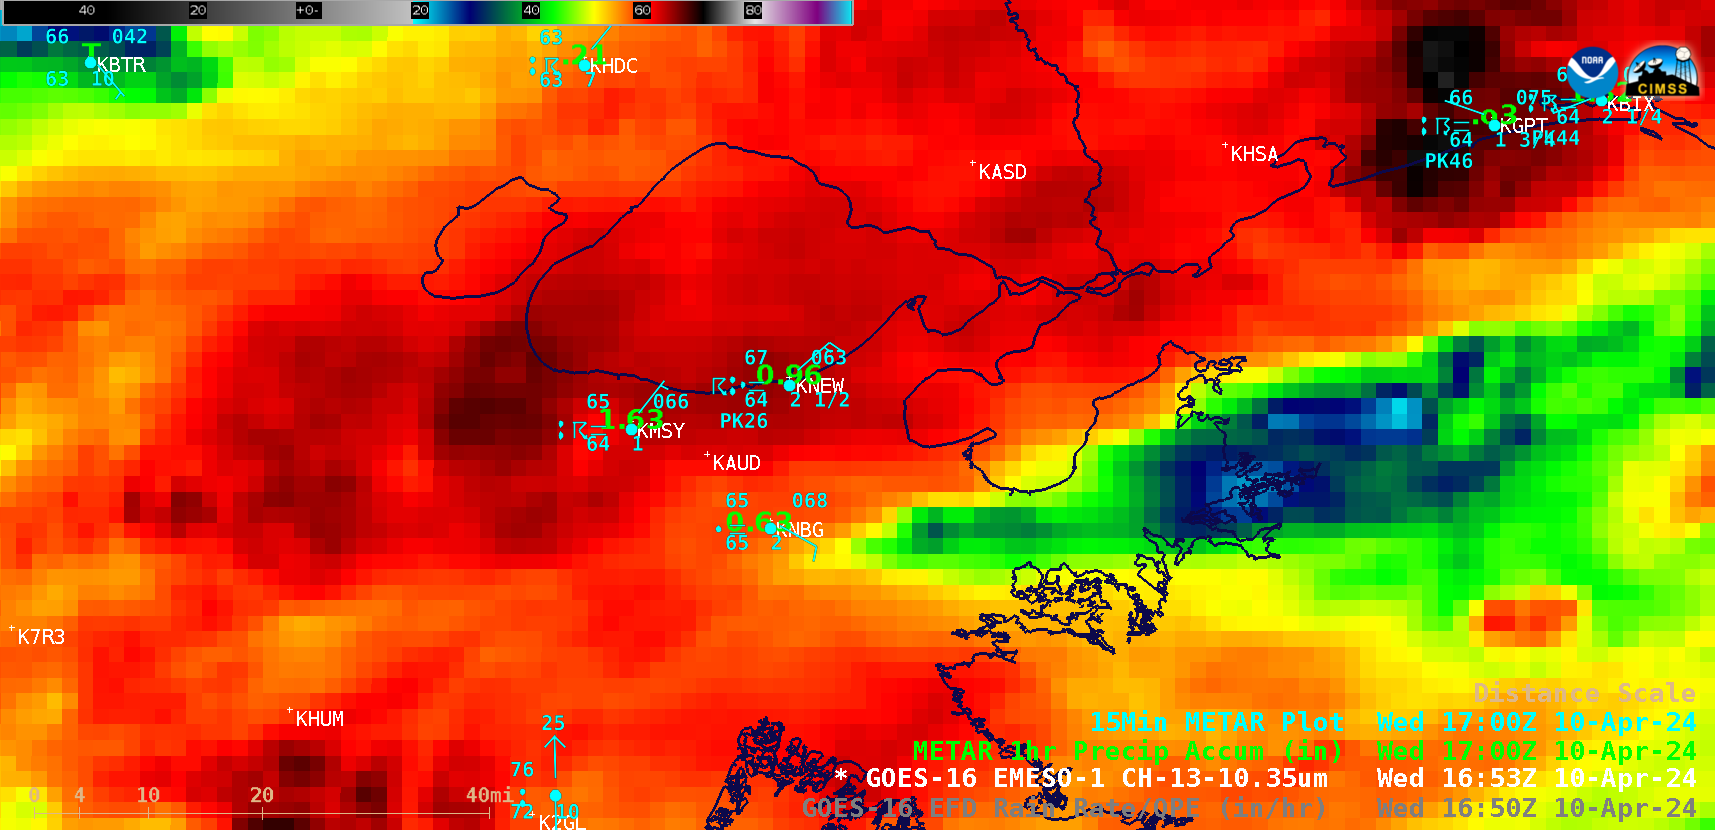
1-minute GOES-16 (10.3 µm) Infrared images from 1200-1900 UTC on 10 April, with plots of 15-minute METAR surface reports (cyan) and 1-hour precipitation accumulation (green) [click to play animated GIF | MP4]
A cursor sample of the GOES-16 cloud-top 10.3 µm infrared brightness temperature at 1250 UTC (below) displayed a corresponding GOES-16 Rain Rate of 2.16 in/hr (below).
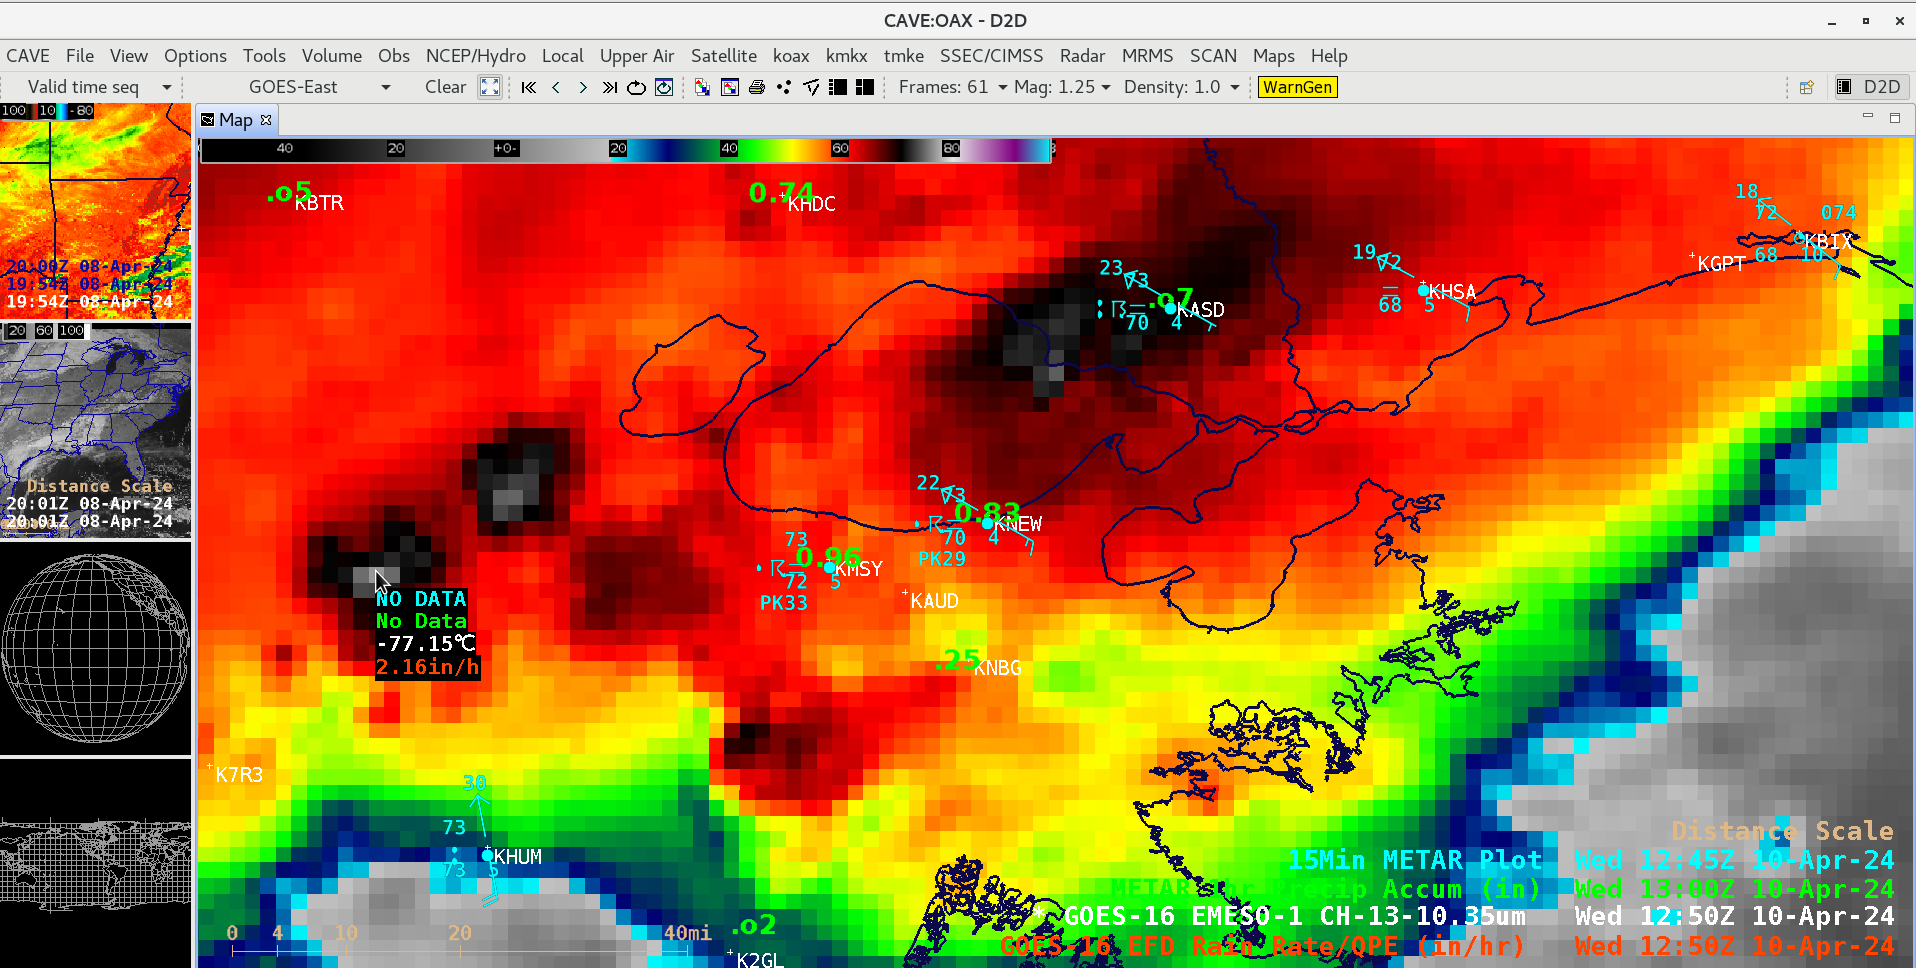
Cursor sample of the 1250 UTC GOES-16 cloud-top 10.3 µm infrared brightness temperature (white) along with the corresponding GOES-16 Rain Rate derived product (red) [click to enlarge]
Just prior to sunrise in southwest Louisiana, another notable event was a convective line that produced EF1/EF2-rated tornadoes in the Lake Charles area — overlapping 1-minute Mesoscale Domain Sectors provided GOES-16 Infrared images at 30-second intervals (below), which showed the pulses of cold overshooting tops associated with these thunderstorms. This event is also discussed from a hyperspectral model perspective in this blog post.
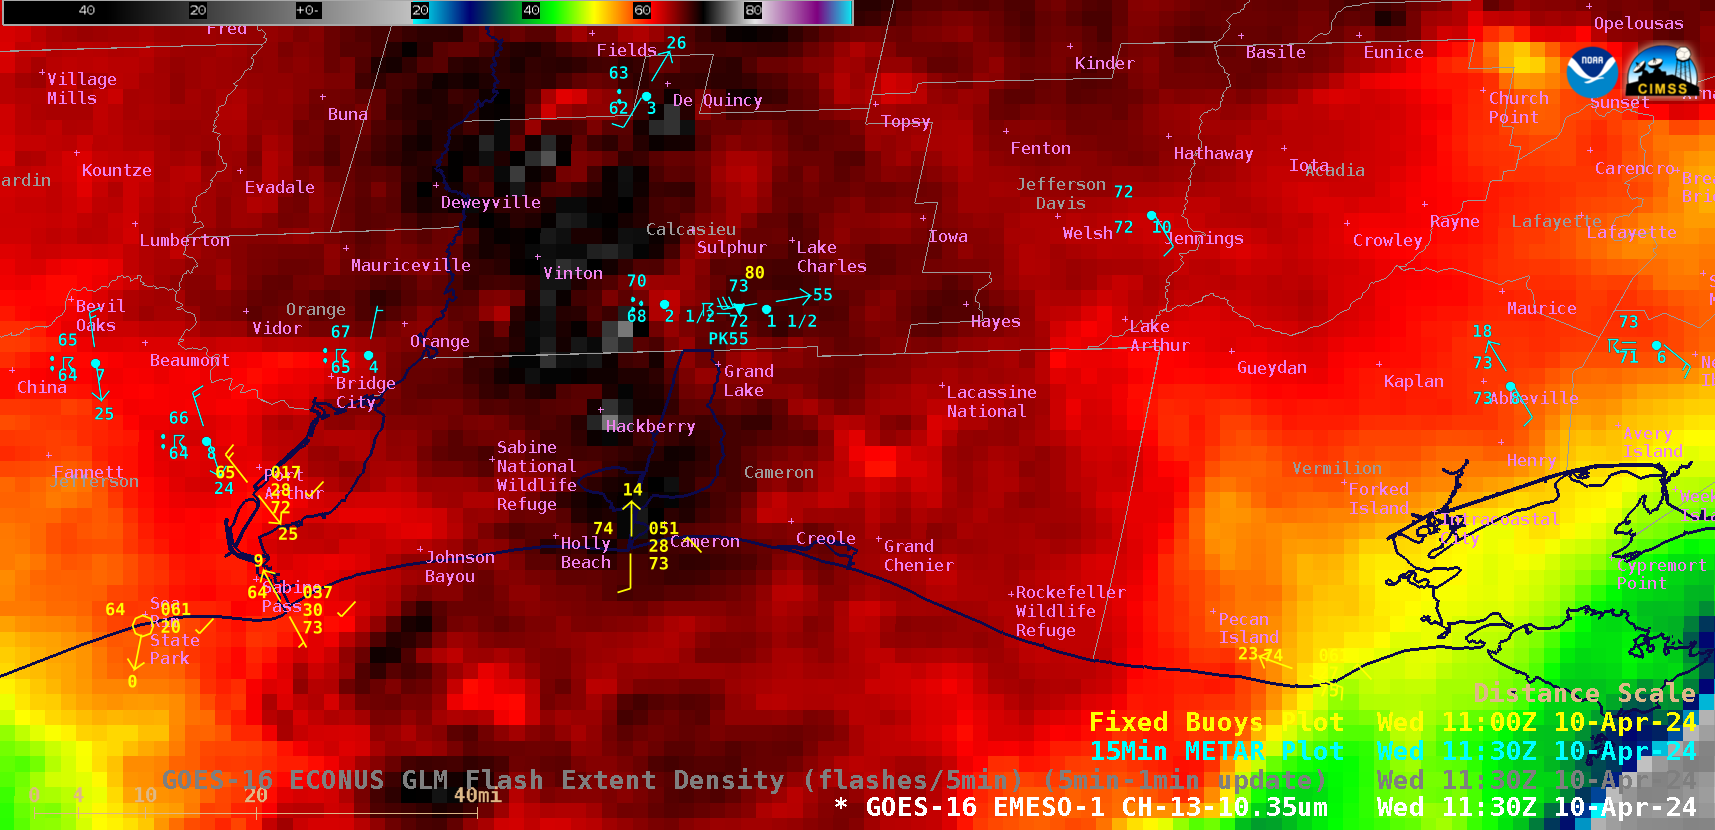
30-second GOES-16 Infrared (10.3 µm) images from 1100-1200 UTC on 10 April, with plots of 15-minute METAR surface reports (cyan) and hourly fixed buoy reports (yellow) [click to play animated GIF | MP4]
A cursor sample of 1126 UTC GOES-16 cloud-top 10.3 µm infrared brightness temperature (below) displayed a corresponding GOES-16 Cloud Top Temperature of -76.11ºC and a Cloud Top Height of 42974.84 ft.
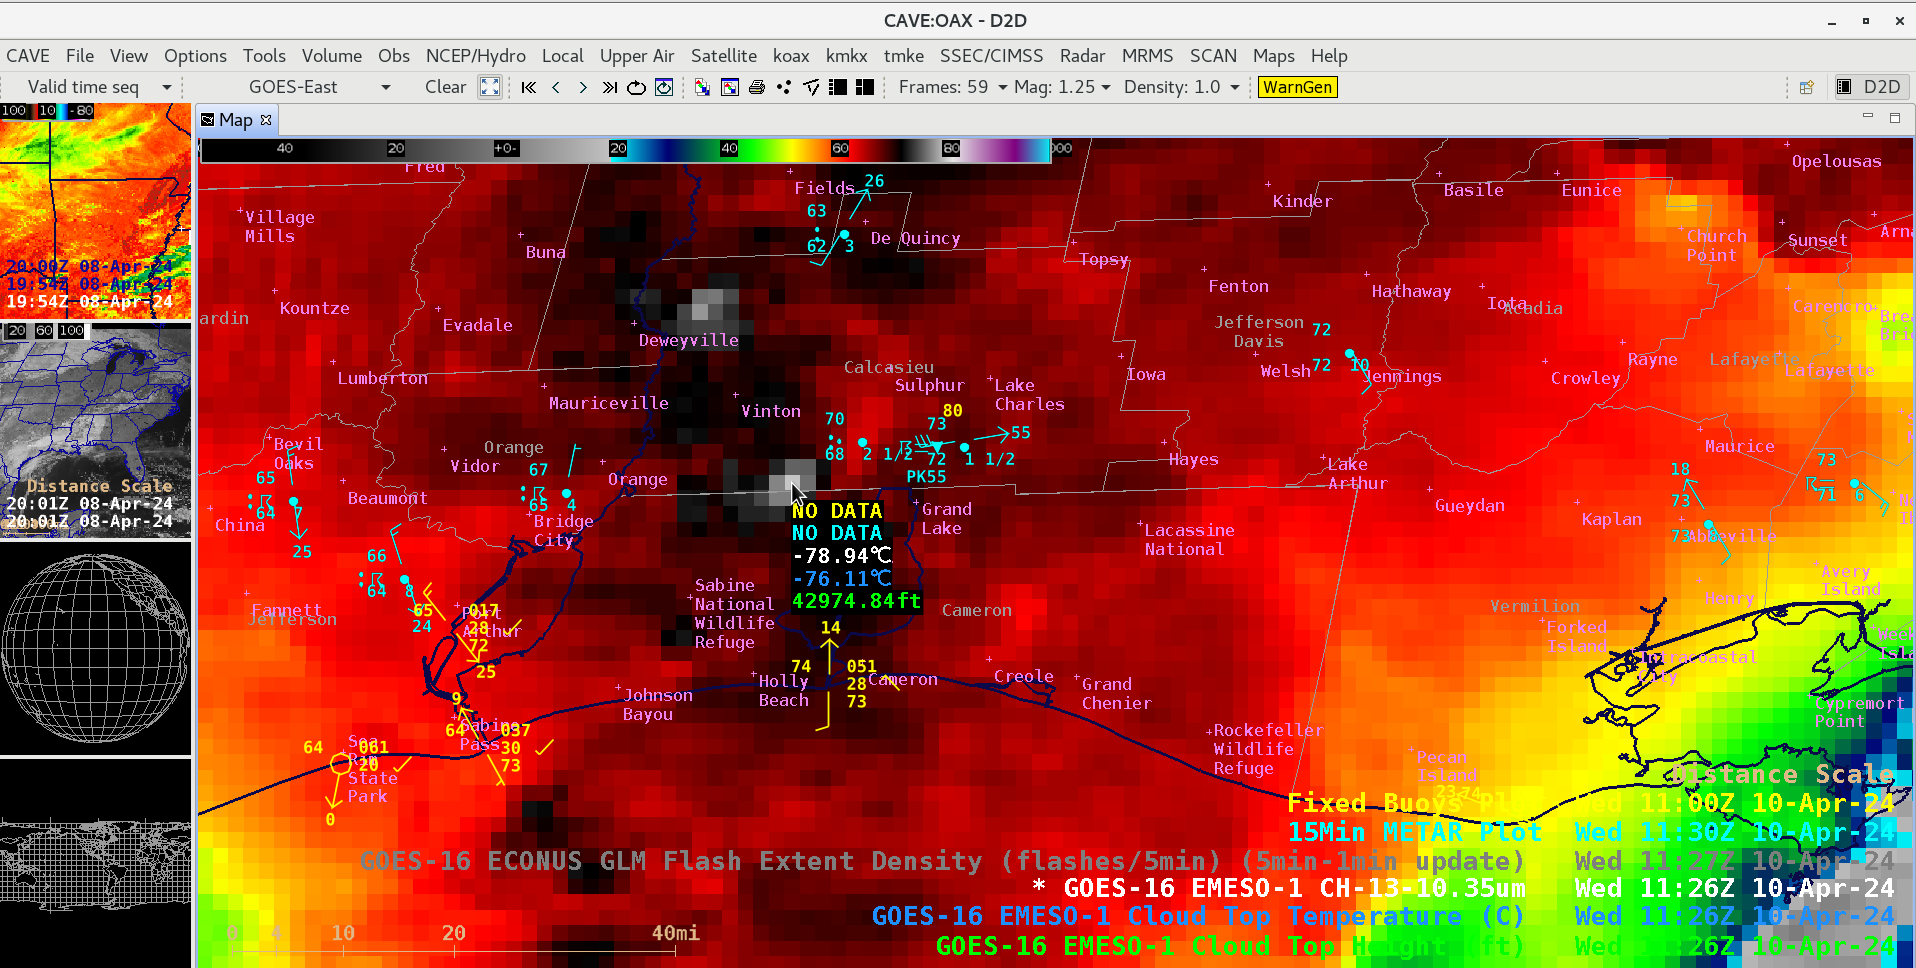
Cursor sample of 1126 UTC GOES-16 cloud-top 10.3 µm infrared brightness temperature (white) along with the corresponding GOES-16 Cloud Top Temperature (blue) and Cloud Top Height (green) derived products [click to enlarge]
30-second GOES-16 Infrared images with an overlay of GLM Flash Extent Density (below) revealed a notable amount of lighting actvity associated with this tornado-producing line of thundertorms.
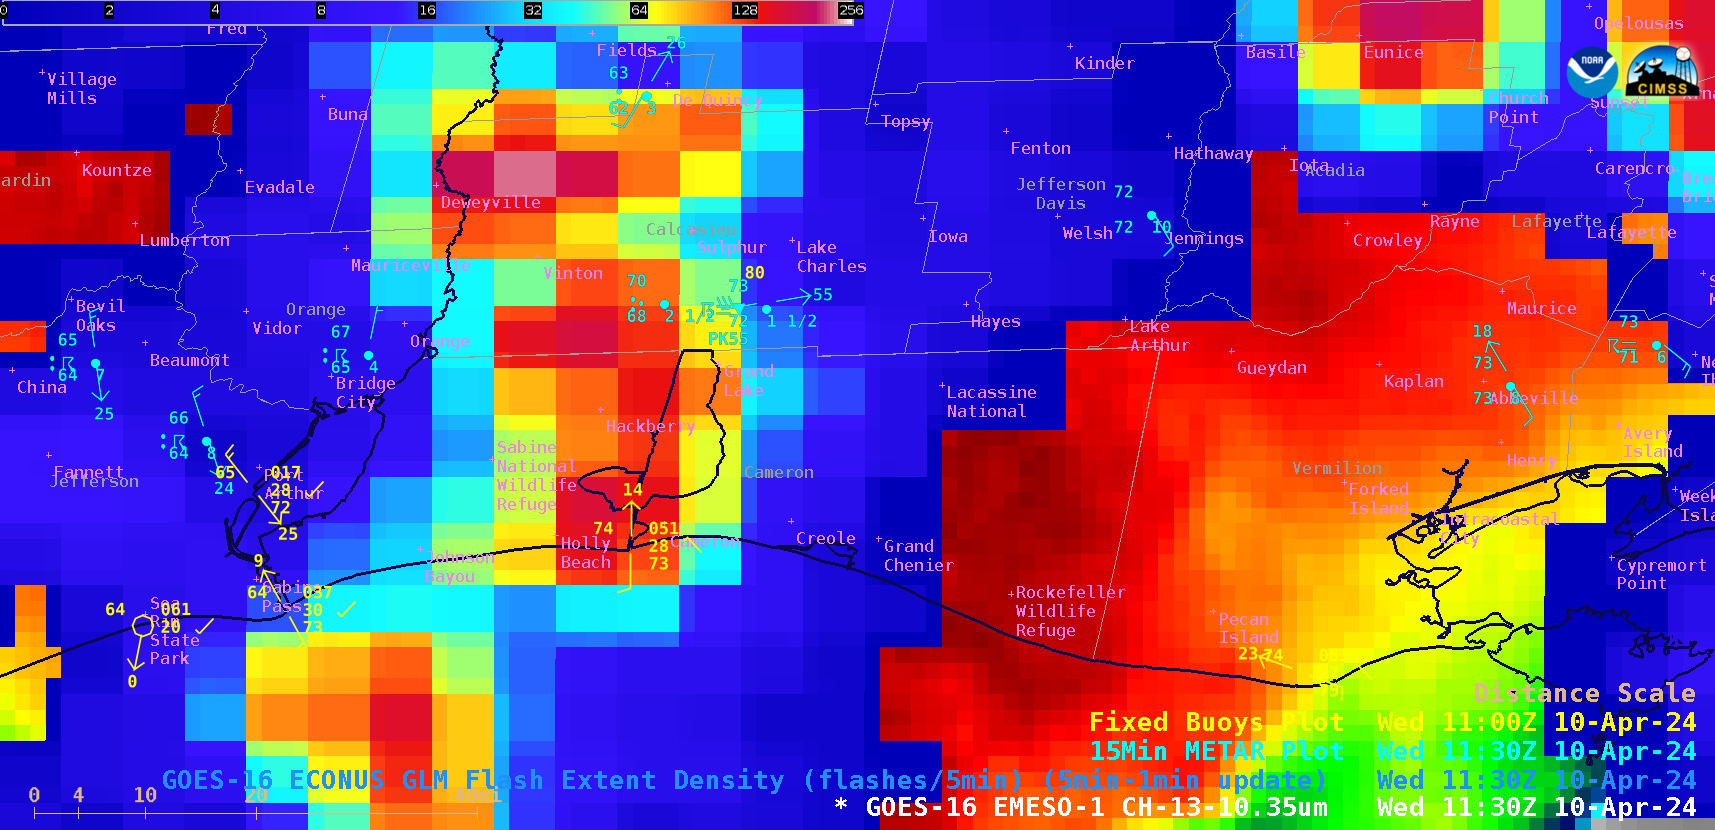
30-second GOES-16 Infrared (10.3 µm) images with an overlay of GLM Flash Extent Density from 1100-1200 UTC on 10 April, including plots of 15-minute METAR surface reports (cyan) and hourly fixed buoy reports (yellow) [click to play animated GIF | MP4]
—————
Free Secure Email – Transcom Sigma
Transcom Hosting
Transcom Premium Domains
