
Severe thunderstorms across Hawai’i
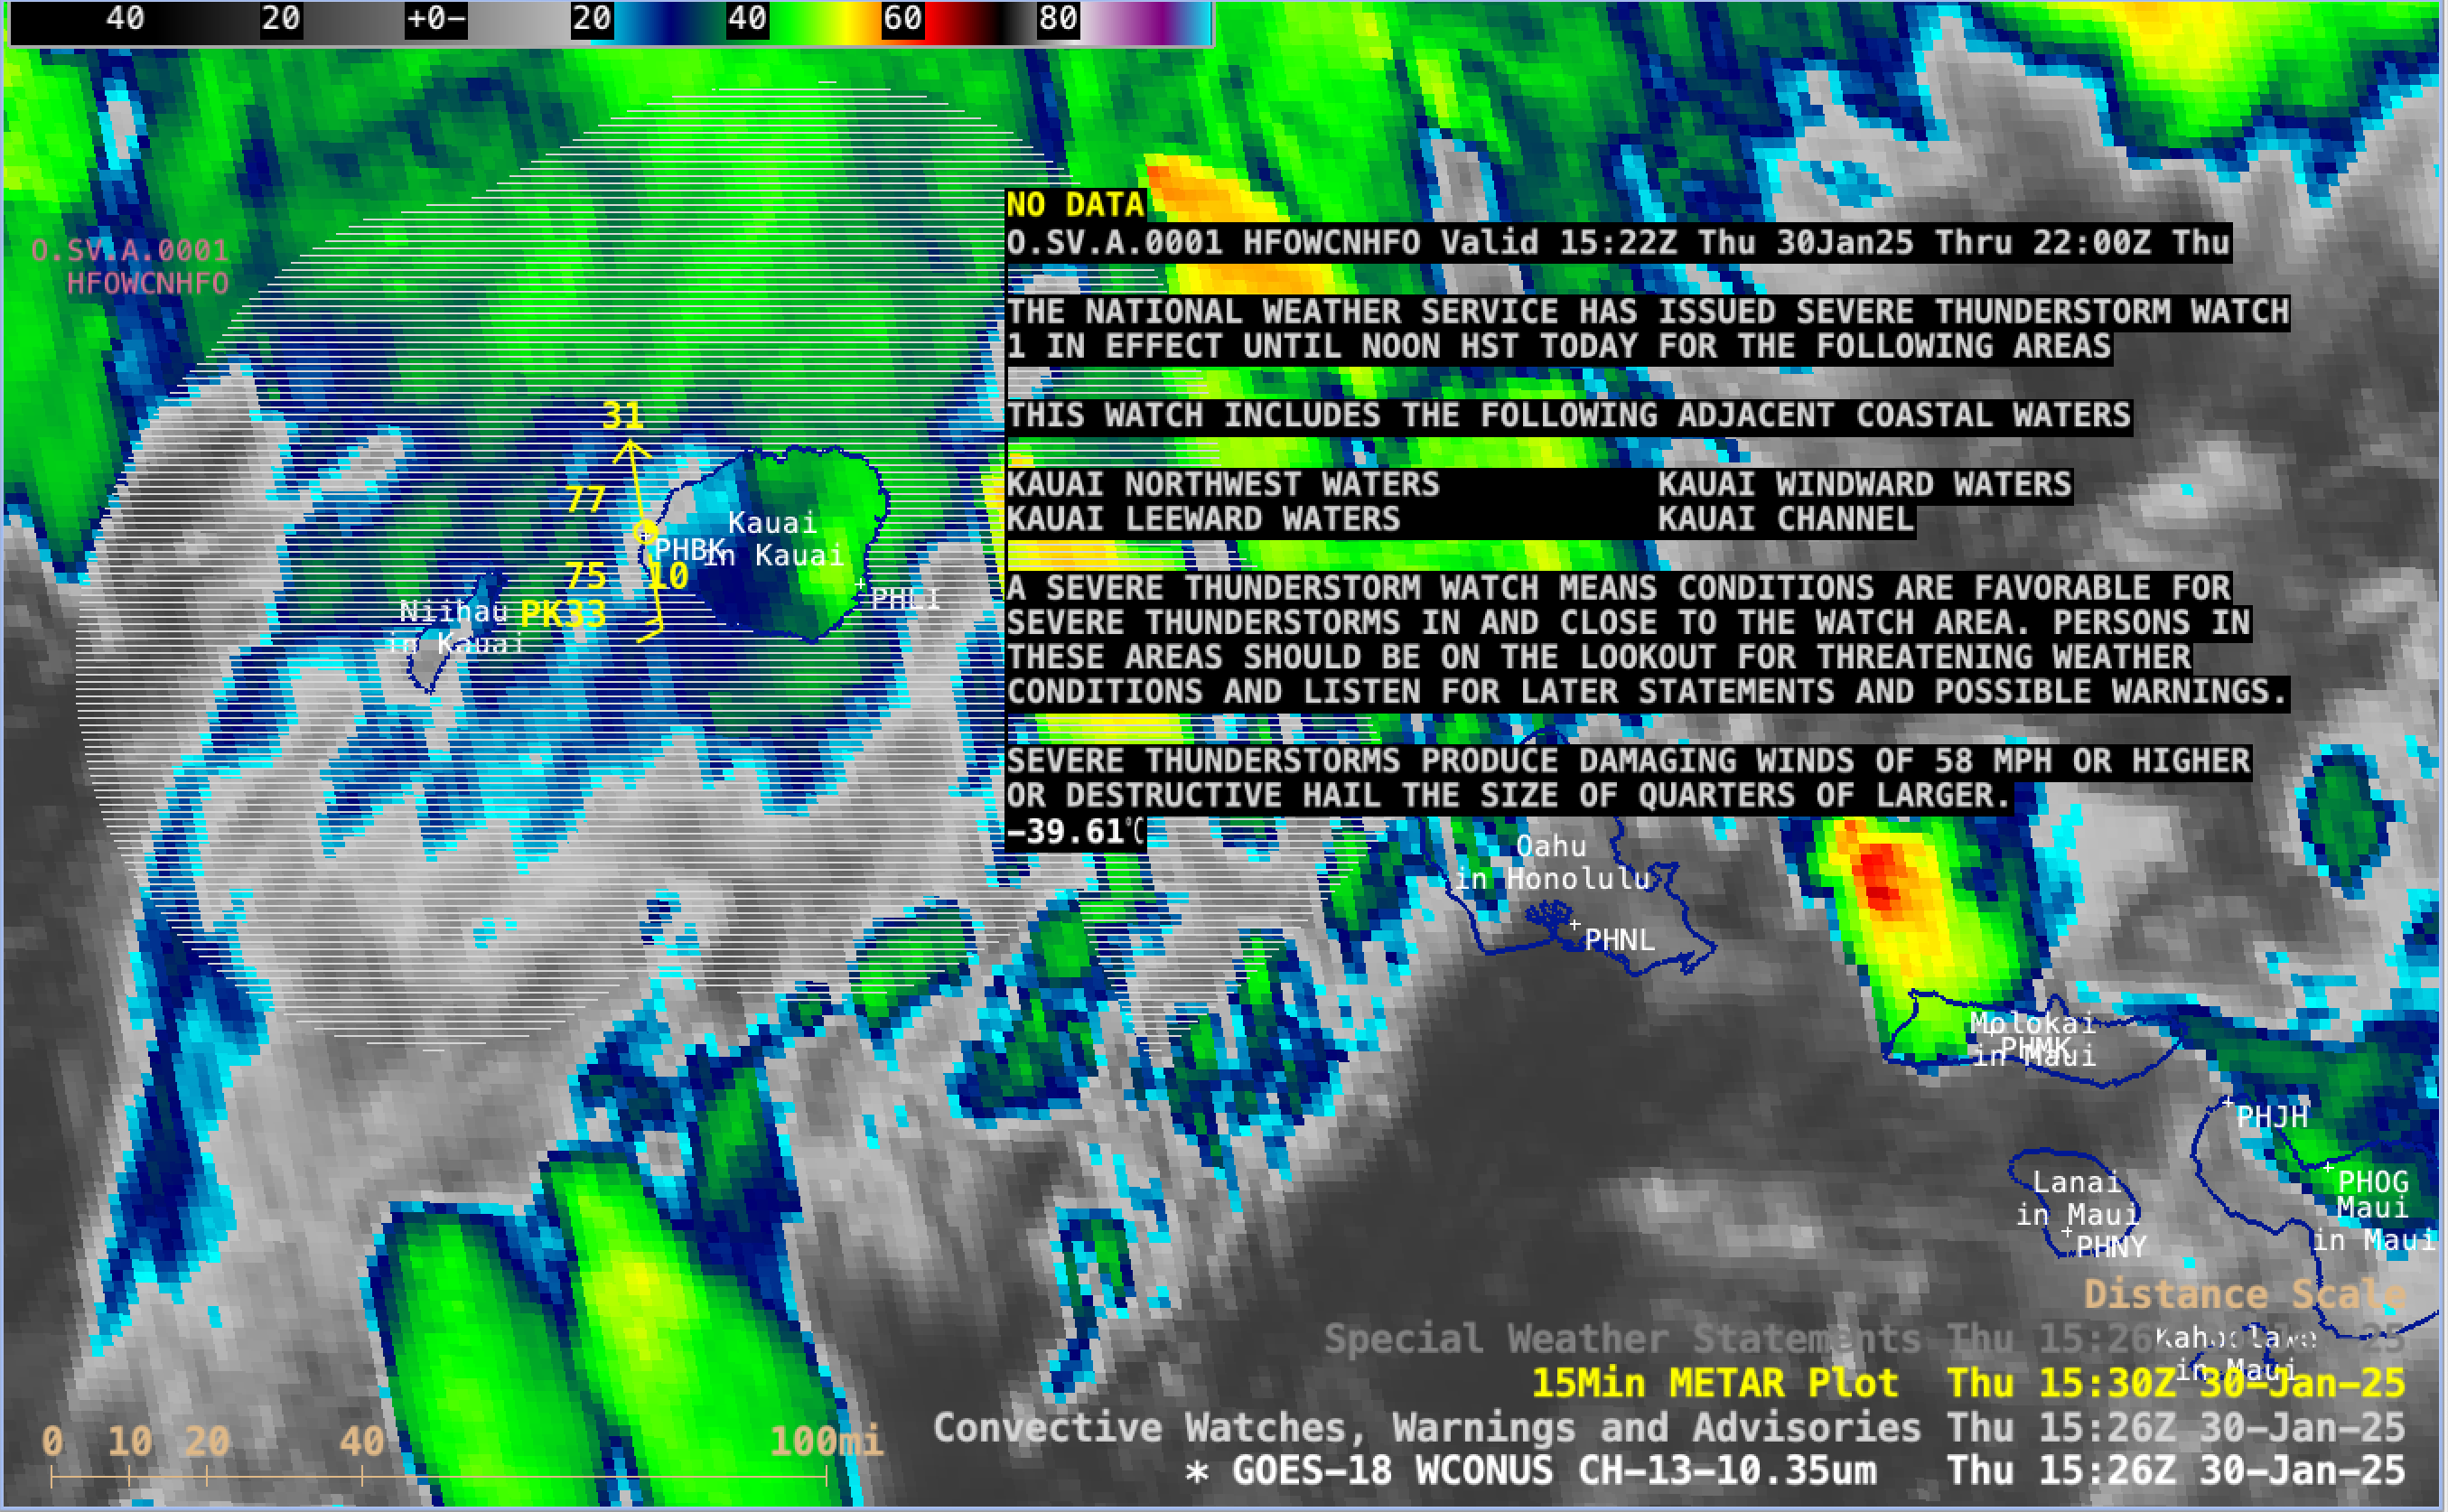
GOES-18 Clean Window Infrared (10.3 µm) image at 1528 UTC, with a cursor sample of the Severe Thunderstorm Watch [click to enlarge]
With the increasing threat for strong to severe convection across the western portion of Hawai’i, a Severe Thunderstorm Watch was issued for an area centered on the island of Kauai at 1522 UTC on 30th January 2025 (above).
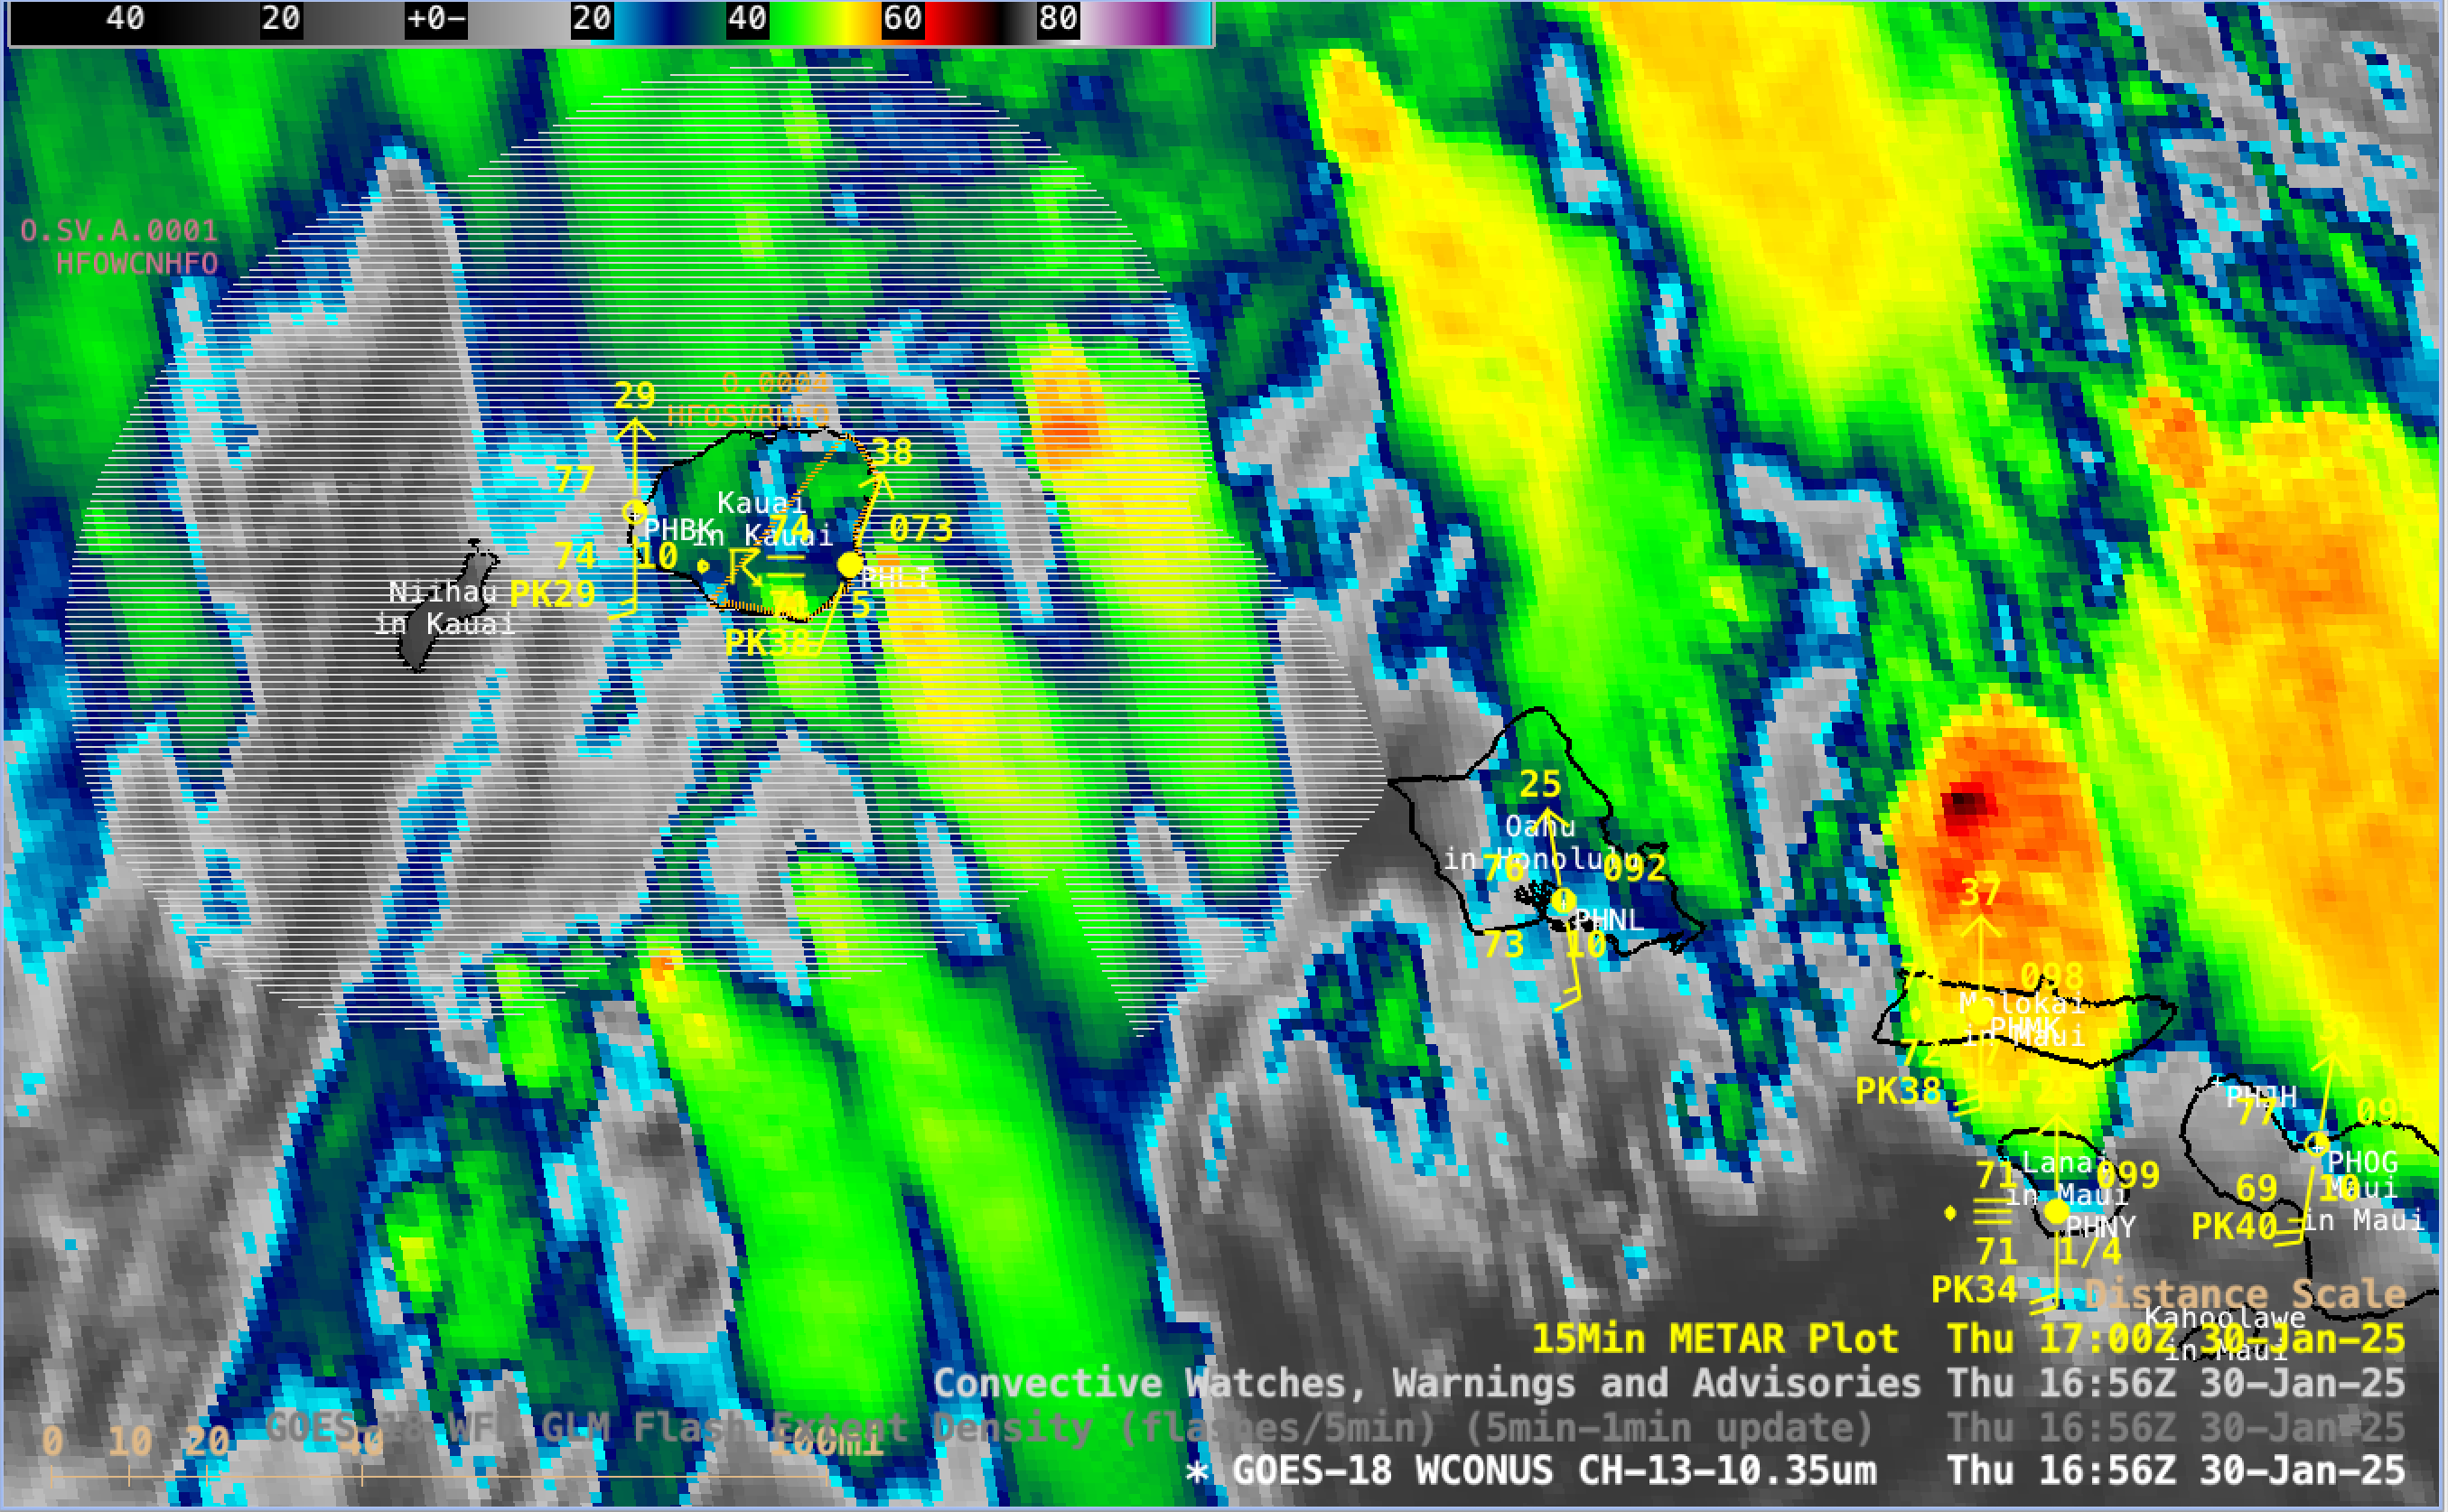
5-minute GOES-18 Clean Infrared Window (10.3 µm) images, from 1106 UTC on 30th January to 0901 UTC on 31st January [click to play MP4 animation]
5-minute CONUS Sector GOES-18 Clean Infrared Window (10.3 µm) images (above) showed elongated clusters of convection moving eastward and northeastward across Kauai and Oahu — with embedded thunderstorms that produced heavy rain and strong winds on those two islands (Local Storm Reports).
A corresponding animation of GOES-18 Infrared images with an overlay of GLM Flash Extent Density (below) displayed the abundant lightning activity associated with these thunderstorms.
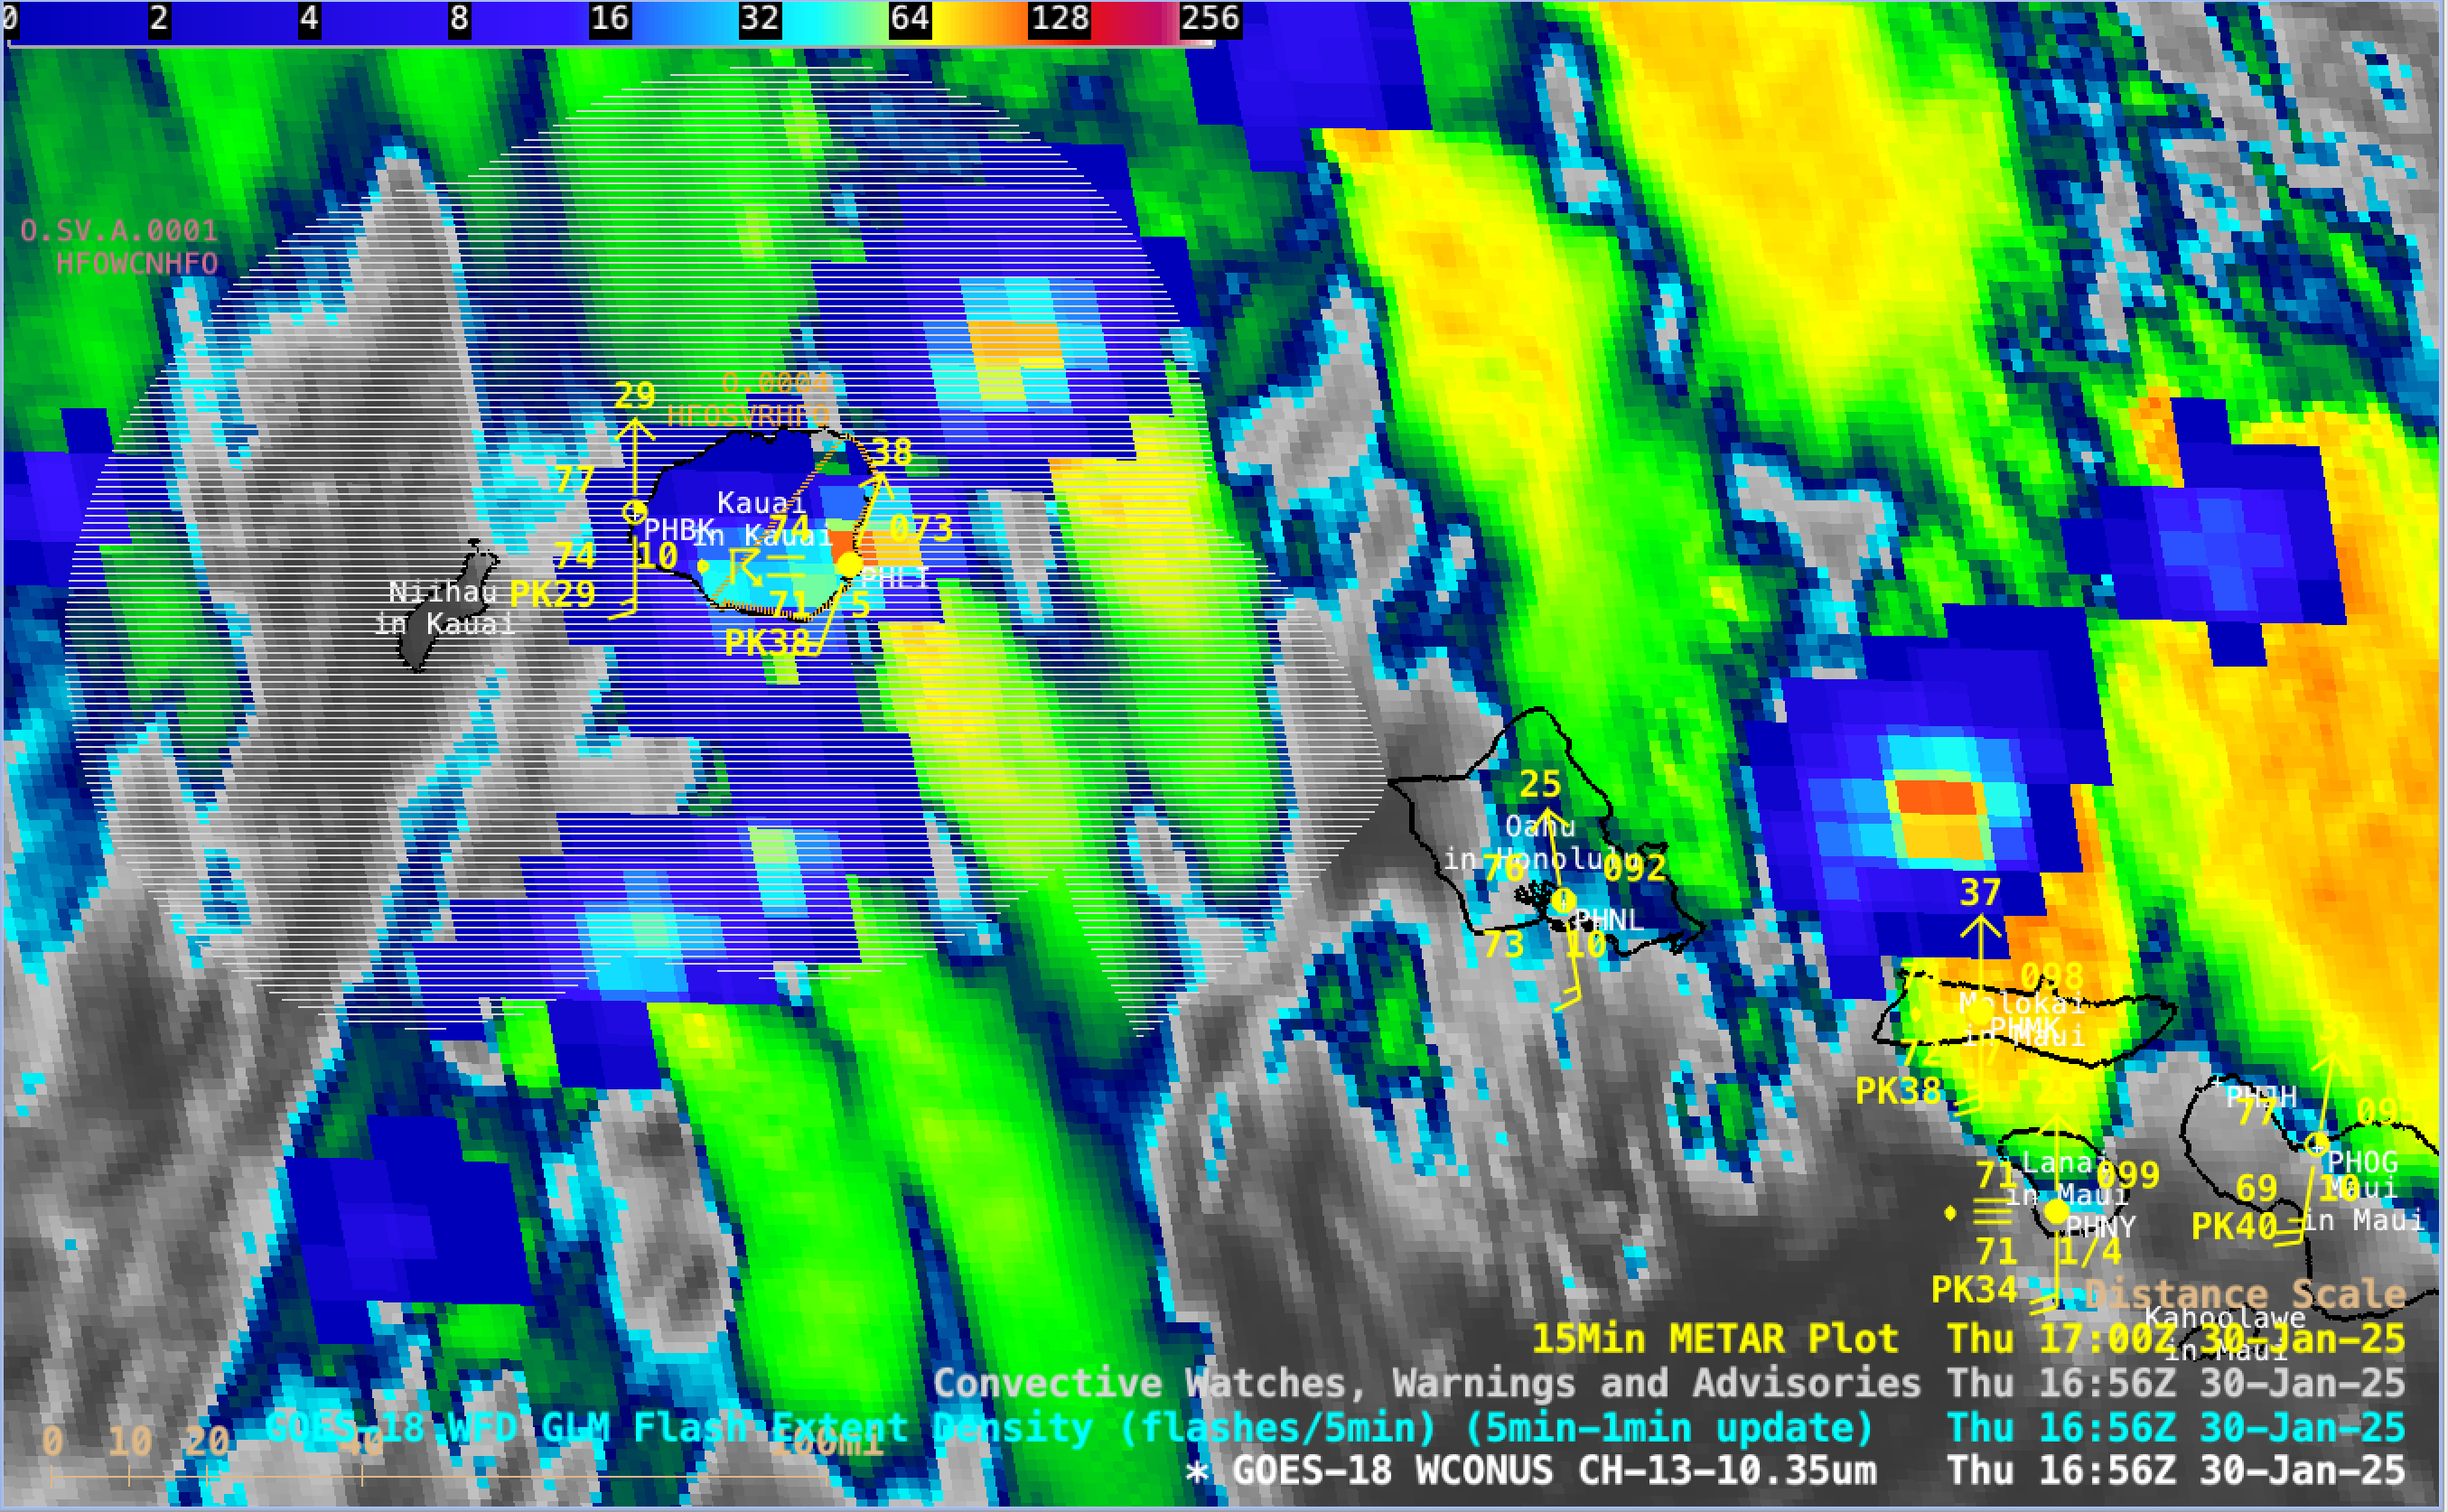
5-minute GOES-18 Clean Infrared Window (10.3 µm) images with an overlay of GLM Flash Extent Density, from 1106 UTC on 30th January to 0901 UTC on 31st January [click to play MP4 animation]
This convection was occurring within the warm sector of a deepening Gale Force to Storm Force low pressure system (bottom left on these surface analyses) that was located NW of the island chain — and the strong SW flow in advance of this storm system (and its cold front) interacting with island terrain produced wind gusts as high as 120 mph on Maui at 0850 UTC.
The air mass within the warm sector was also unusually moist — in fact, a new daily record rainfall of 3.57 inches occurred at Honolulu. The Total Precipitable Water (PW) value of 1.98″ derived from Lihue, Kauai rawinsonde data at 1200 UTC on 30th January was a record high value for that date/time, according to the SPC Sounding Climatology site (below).
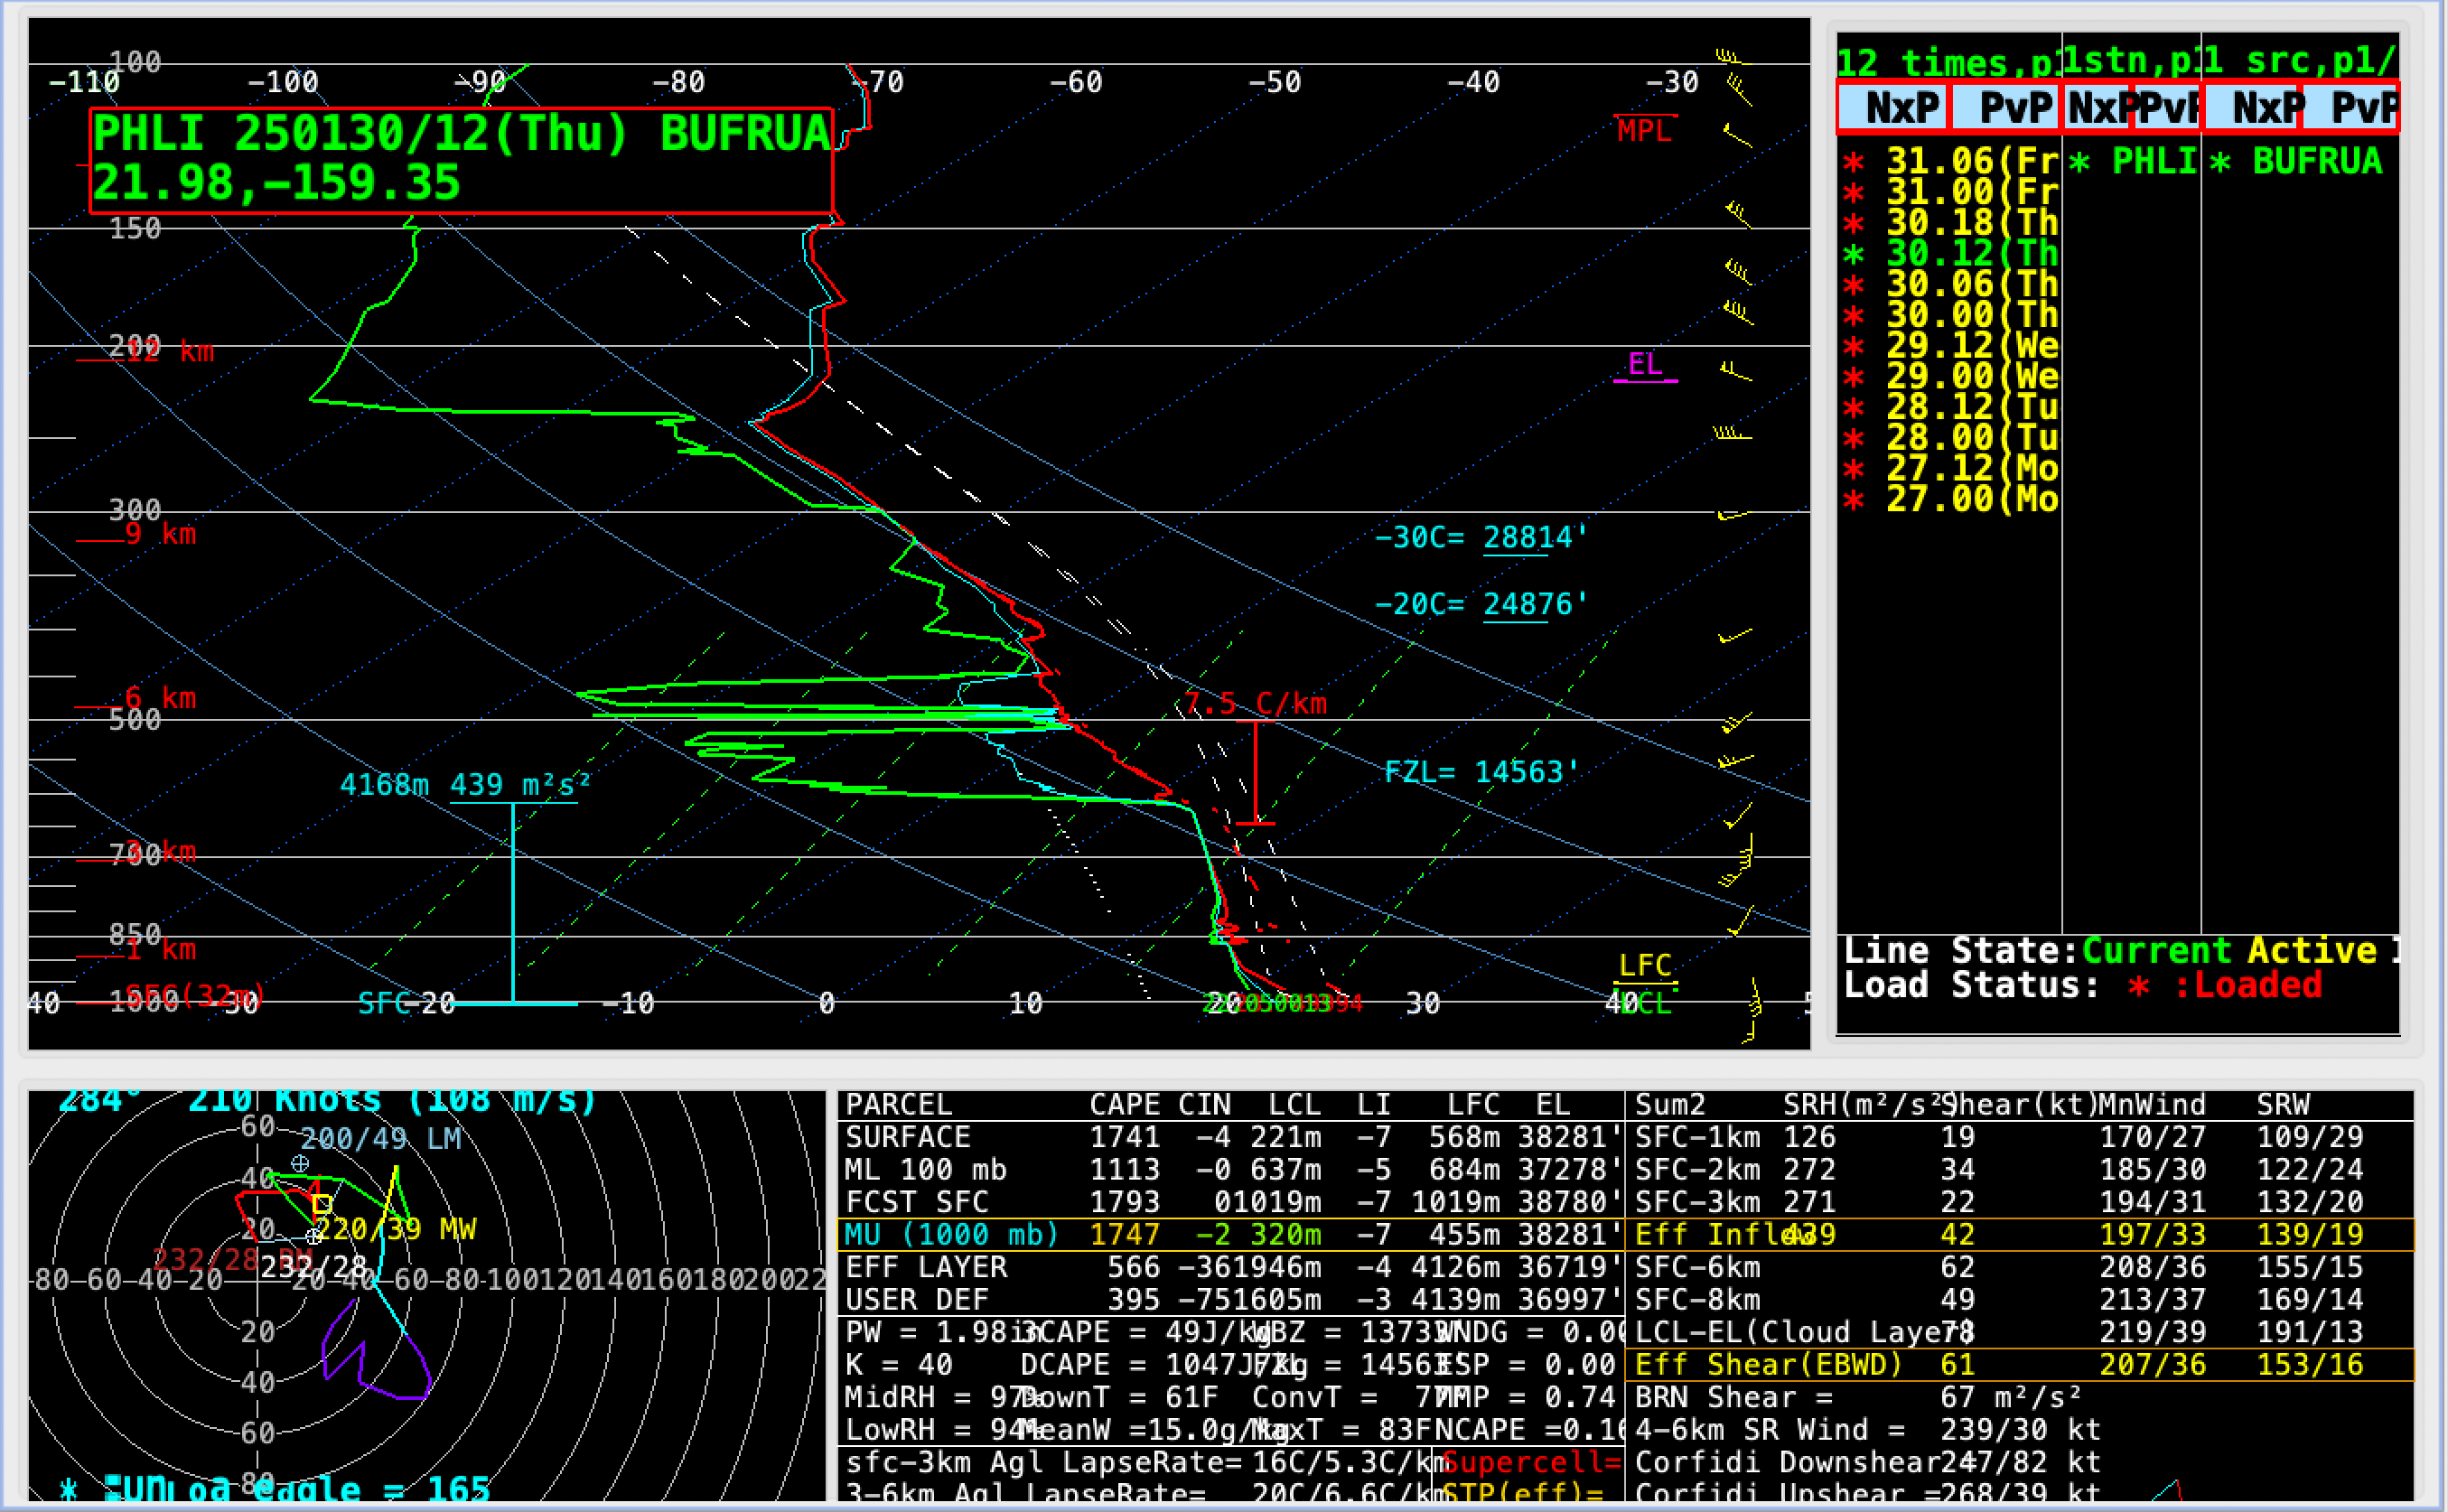
Plot of Lihue rawinsonde data at 1200 UTC on 30th January [click to enlarge]
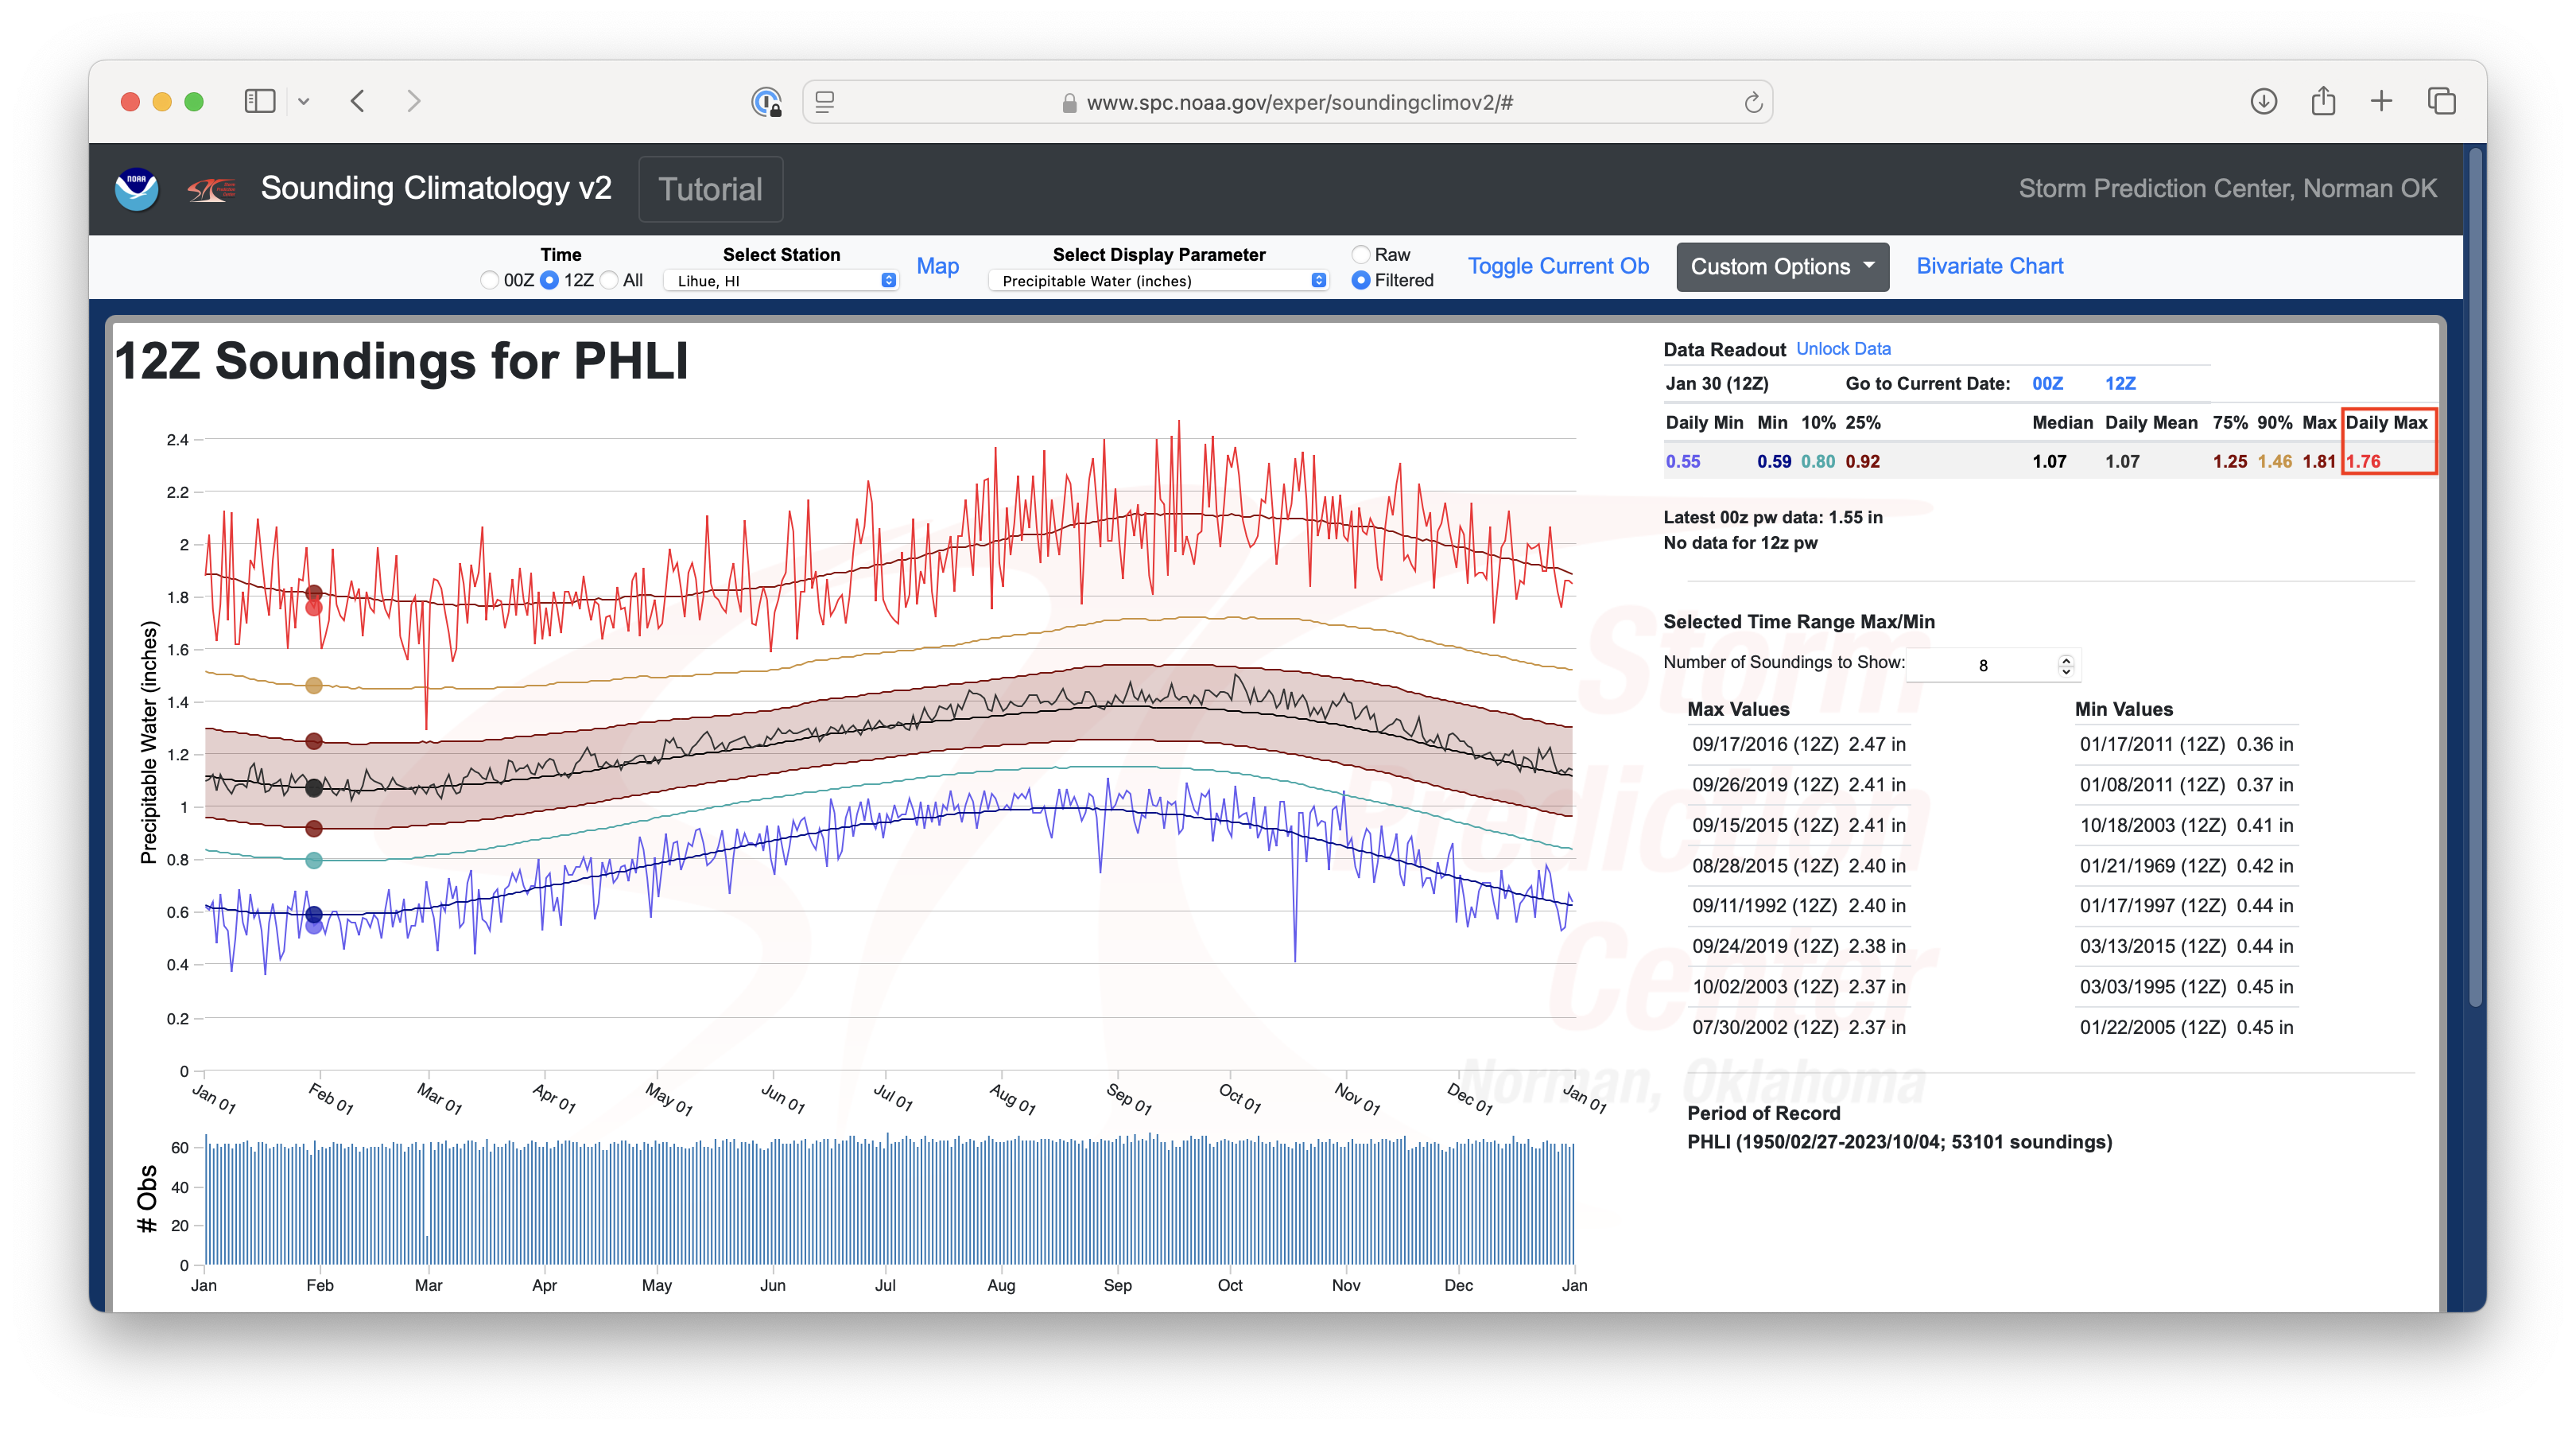
Climatology of Total Precipitable Water for Lihue at 1200 UTC on 30th January [click to enlarge]
The PW value derived from Lihue rawinsonde data at 1800 UTC on 30th January (about 2.5 hours after the Severe Thunderstorm Watch was issued) was even higher, at 2.06″ (below).

Plot of Lihue rawinsonde data at 1800 UTC on 30th January [click to enlarge]
—————
Free Secure Email – Transcom Sigma
Transcom Hosting
Transcom Premium Domains