
September Storms
A positively-tilted upper-level trough generated severe thunderstorms across the eastern U.S. recently. The associated surface low-pressure system with attendant cold front spawned numerous severe storms from Mississippi to Ohio to Virigina.
The LightningCast model picked up on this developing convection, providing 10-30 minutes of lead time to lightning initiation in many convective cells (measured from the 30% probability threshold). LightningCast uses an AI model and GOES-R Advanced Baseline Imager inputs to predict the next-hour probability of lightning.
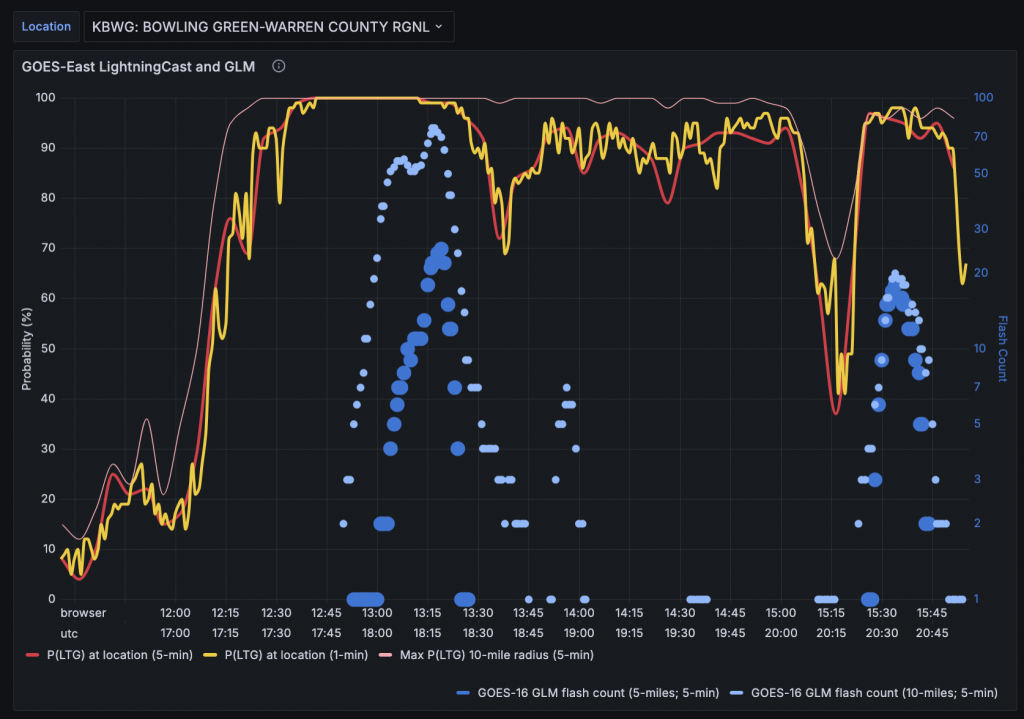
Near Bowling Green, Tennessee, convective cores ramped up quickly into thunderstorms and affected the regional airport with flash rates of 70 flashes per 5-minutes within 5 miles of the airport. The meteogram below shows the probability of lightning near the airport, (the red line is derived from the GOES-16 5-minute CONUS scan and the yellow is derived from the GOES-16 1-minute mesoscale scan) which increased well ahead of observed lightning (blue dots) from the Geostationary Lightning Mapper (GLM).
Further west In Oklahoma, on the backside of the upper-trough, a supercell thunderstorm produced hail up to 2″ in diameter. The storm popped up from below a cloud deck, as observed from GOES-18 (GOES-West) and quickly became electrified. LightningCast provided 17 minutes of lead time to lightning initiation (measured from the 30% contour).
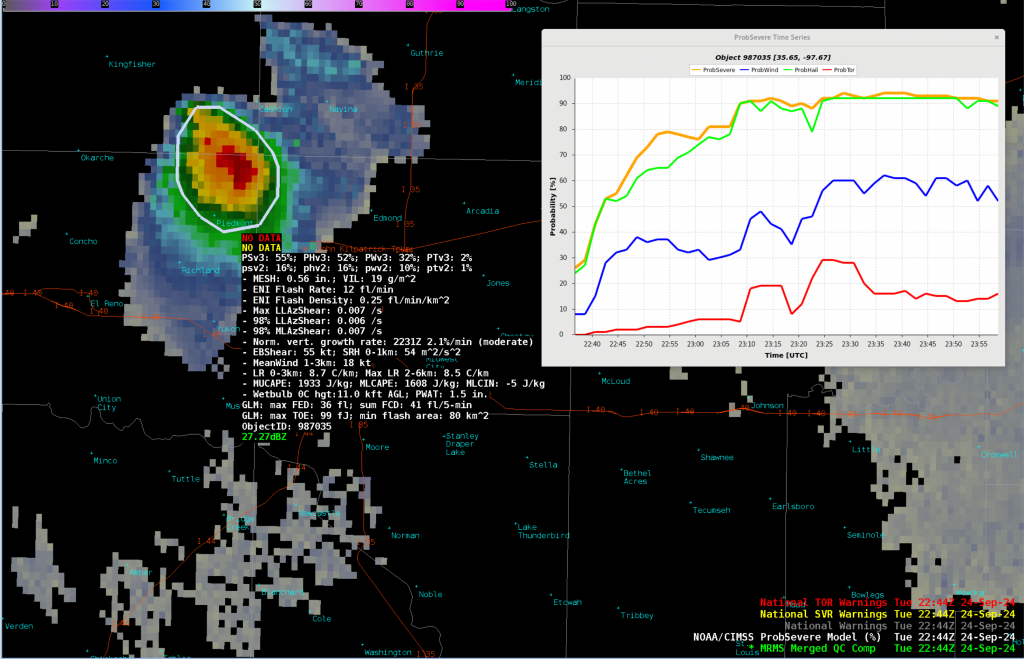
The storm was severe-warned 20 minutes after electrification, and 15 minutes thereafter began producing hail with diameters in excess 1″. Severe hail was reported across the Oklahoma City metro area. From the animation below, we can see the storm’s rightward lurch to the south. The storm contours are from the ProbSevere version 3 system.
ProbSevere version 3 improved upon version 2 in this supercell, with a 55% probability of severe just prior to the initial NWS warning, whereas version 2 was at 16% (see image below). An offline analysis revealed that the top-5 most-important predictors for the storm at this time were:
- Total flash rate (12 flashes/minute)
- Lapse rate 0-3 km (8.7 C/km)
- Effective bulk shear (55 kt)
- Max MESH (0.56″)
- Satellite growth rate (2.1%/minute [moderate])
Mid-level rotation parameters and mid-level storm-relative wind (39 kt) were the next highest contributing predictors. ProbSevere v3 regularly provided improved predictions of severe weather, often extending potential lead time to initial hazards and situational awareness to forecasters. Both LightningCast and ProbSevere v3 will hopefully be operational in 2025.
—————
Free Secure Email – Transcom Sigma
Transcom Hosting
Transcom Premium Domains