
Satellite estimates of Heavy Rain over Hawaii
The potent cyclone (surface analysis, an airmass RGB animation from the College of Dupage website is below) that caused severe weather over Hawaii (blog post) is also drenching the islands with considerable rains. The animation of MIMIC Total Precipitable Water, above, shows the storm drawing tropical moisture northward from the Intertropical Convergence Zone. The airmass RGB, below, also shows that connection to the tropics, with the green area in the RGB that is moving northward over Hawaii.
How have various estimates of precipitation quantified the rains that have fallen? Hourly CMORPH-2 Rain Estimates captured at this RealEarth site (enter ‘CMORPH’ into the Search box; this website has data through 31 December 2024), below, capture the progress of the heavy rain band across the islands, mostly west to east, but with a couple of seemingly backward steps.
In contrast, GOES-18 GREMLIN estimates of MRMS radar reflectivity, shown below with GOES-18 mid-level water vapor infrared imagery, shows steady eastward progress to the heavy rainband. A band of lighter precipitation persists over Kauai however. The animation below suggests the backward steps in the CMORPH hourly precipitation shown above are artifacts that bear investigation. A discussion on how GREMLIN rain estimates are used over Pago Pago in the south Pacific is available here.
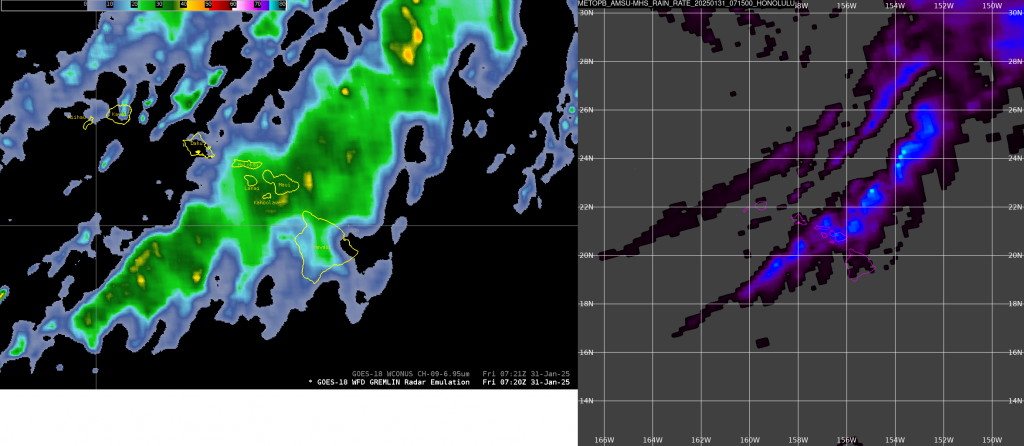
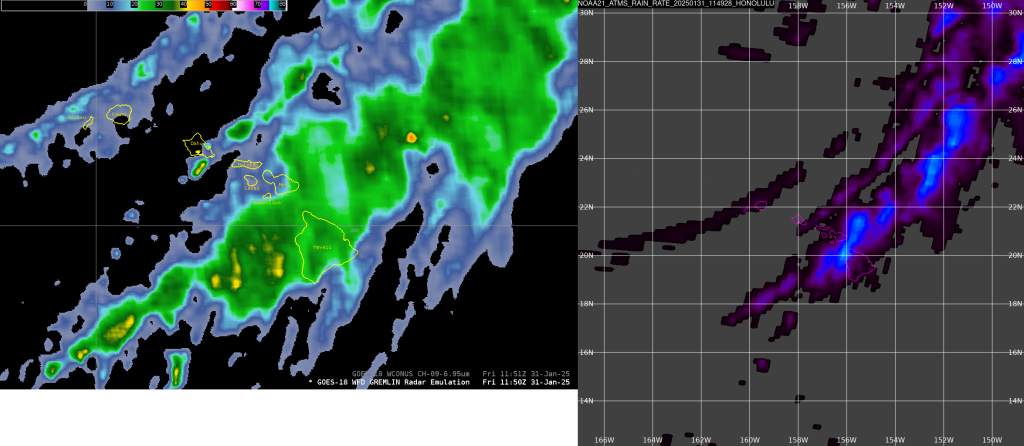
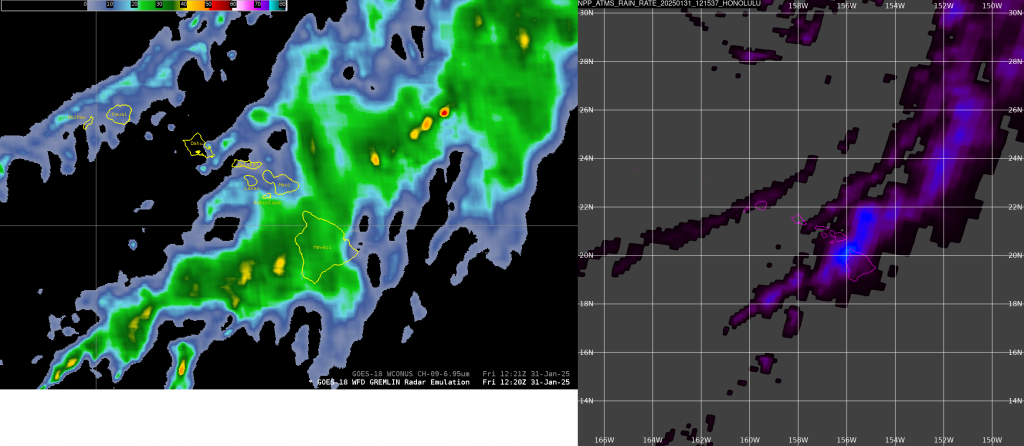
There is a direct broadcast antenna at Honolulu Community College (link) and microwave data from that site can be used to derive instantaneous rain rates (via MIRS algorithms). The animation below shows three snapshots between 0715 and 1215 UTC.

How do the instantaneous rain rates compare with GREMLIN MRMS estimates? Three comparisons are shown below. The figures are qualitatively similar.
When evaluating heavy rains, there are many products available to a forecaster. Use them all to increase confidence in the diagnostics.
—————
Free Secure Email – Transcom Sigma
Transcom Hosting
Transcom Premium Domains