Rain and Snow over the western Great Lakes
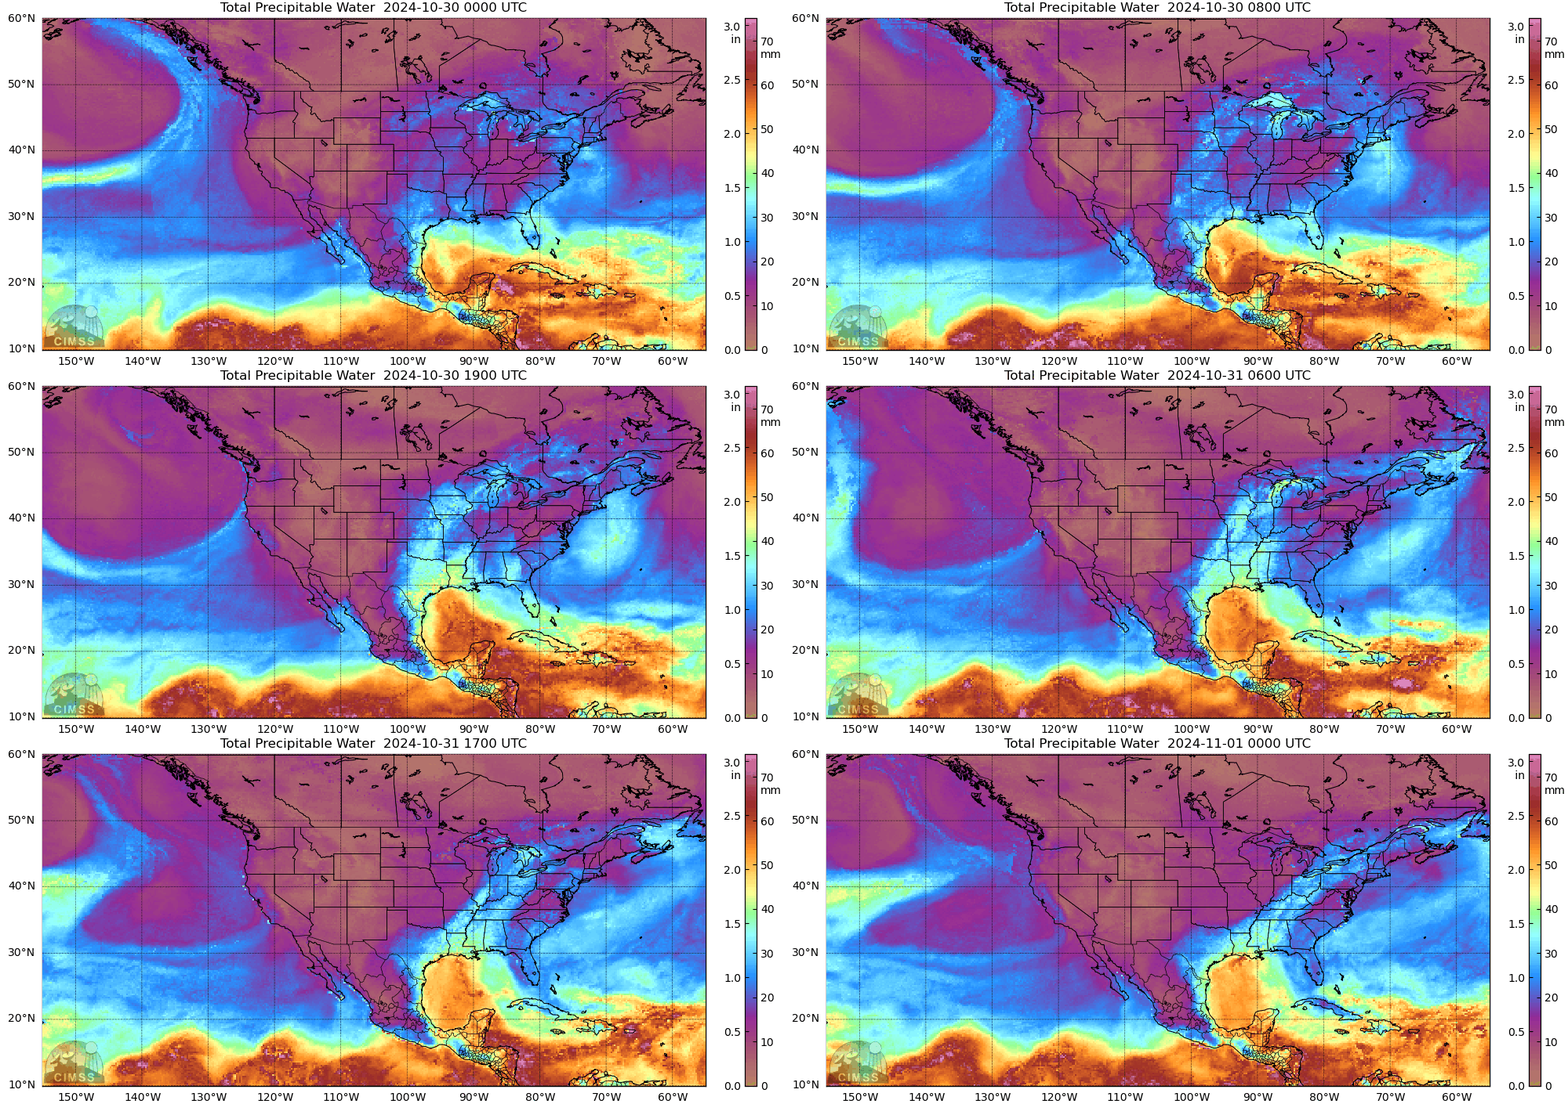
GOES-East airmass RGB imagery, above, shows the evolution of a strong system that brought heavy rain to the central United States as well as snow over the western Great Lakes. The Potential Vorticity Anomaly that supported the surface cyclone, orange in the RGB shown above, starts over the Rocky Mountains and moves northeastward to the northern Plains before shifting more eastward across the Great Lakes at the end of the animation. Total Precipitable water fields from MIMIC, below (archived here), show the deep moisture drawn northward from the Gulf of Mexico that the system could access. Madison, WI, set a daily record rainfall — 2.21″ — on 30 October. You might also infer deep moisture in the airmass RGB where the field is a deep green color.
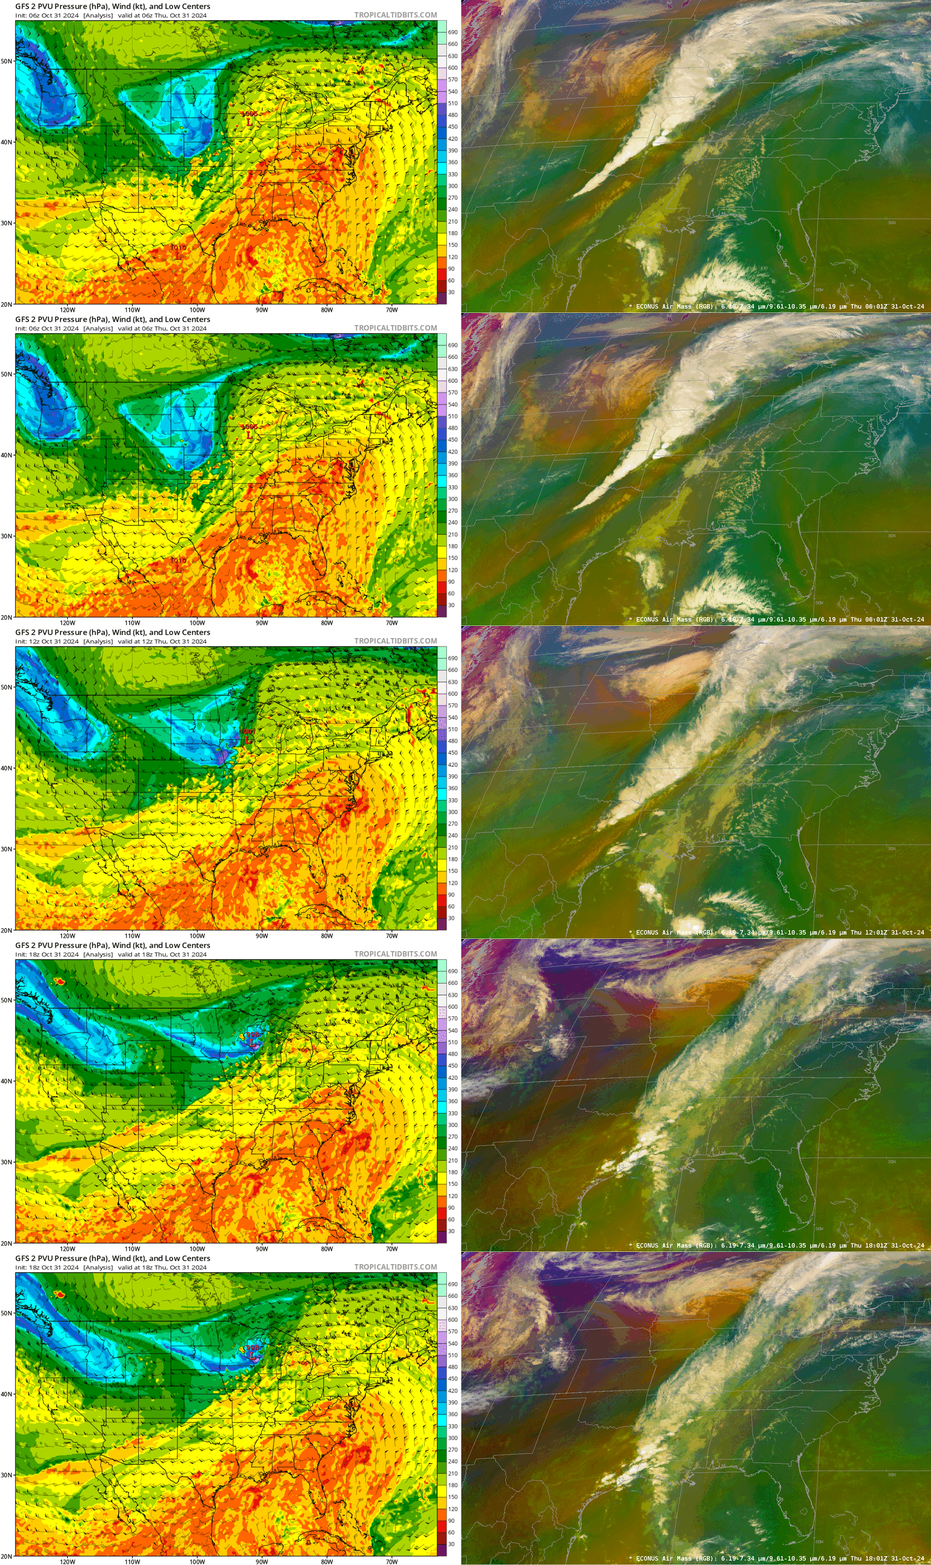
The images below compare GFS pressures on the 2 PVU surface (source) to the airmass RGB fields at the same time. There is good (but not perfect) spatial agreement between the modeled initial pressure maximum on the 2 PVU surface (that is, a lowered tropopause associated with the Potential Vorticity Anomaly) and the orange-hued region in the airmass RGB.
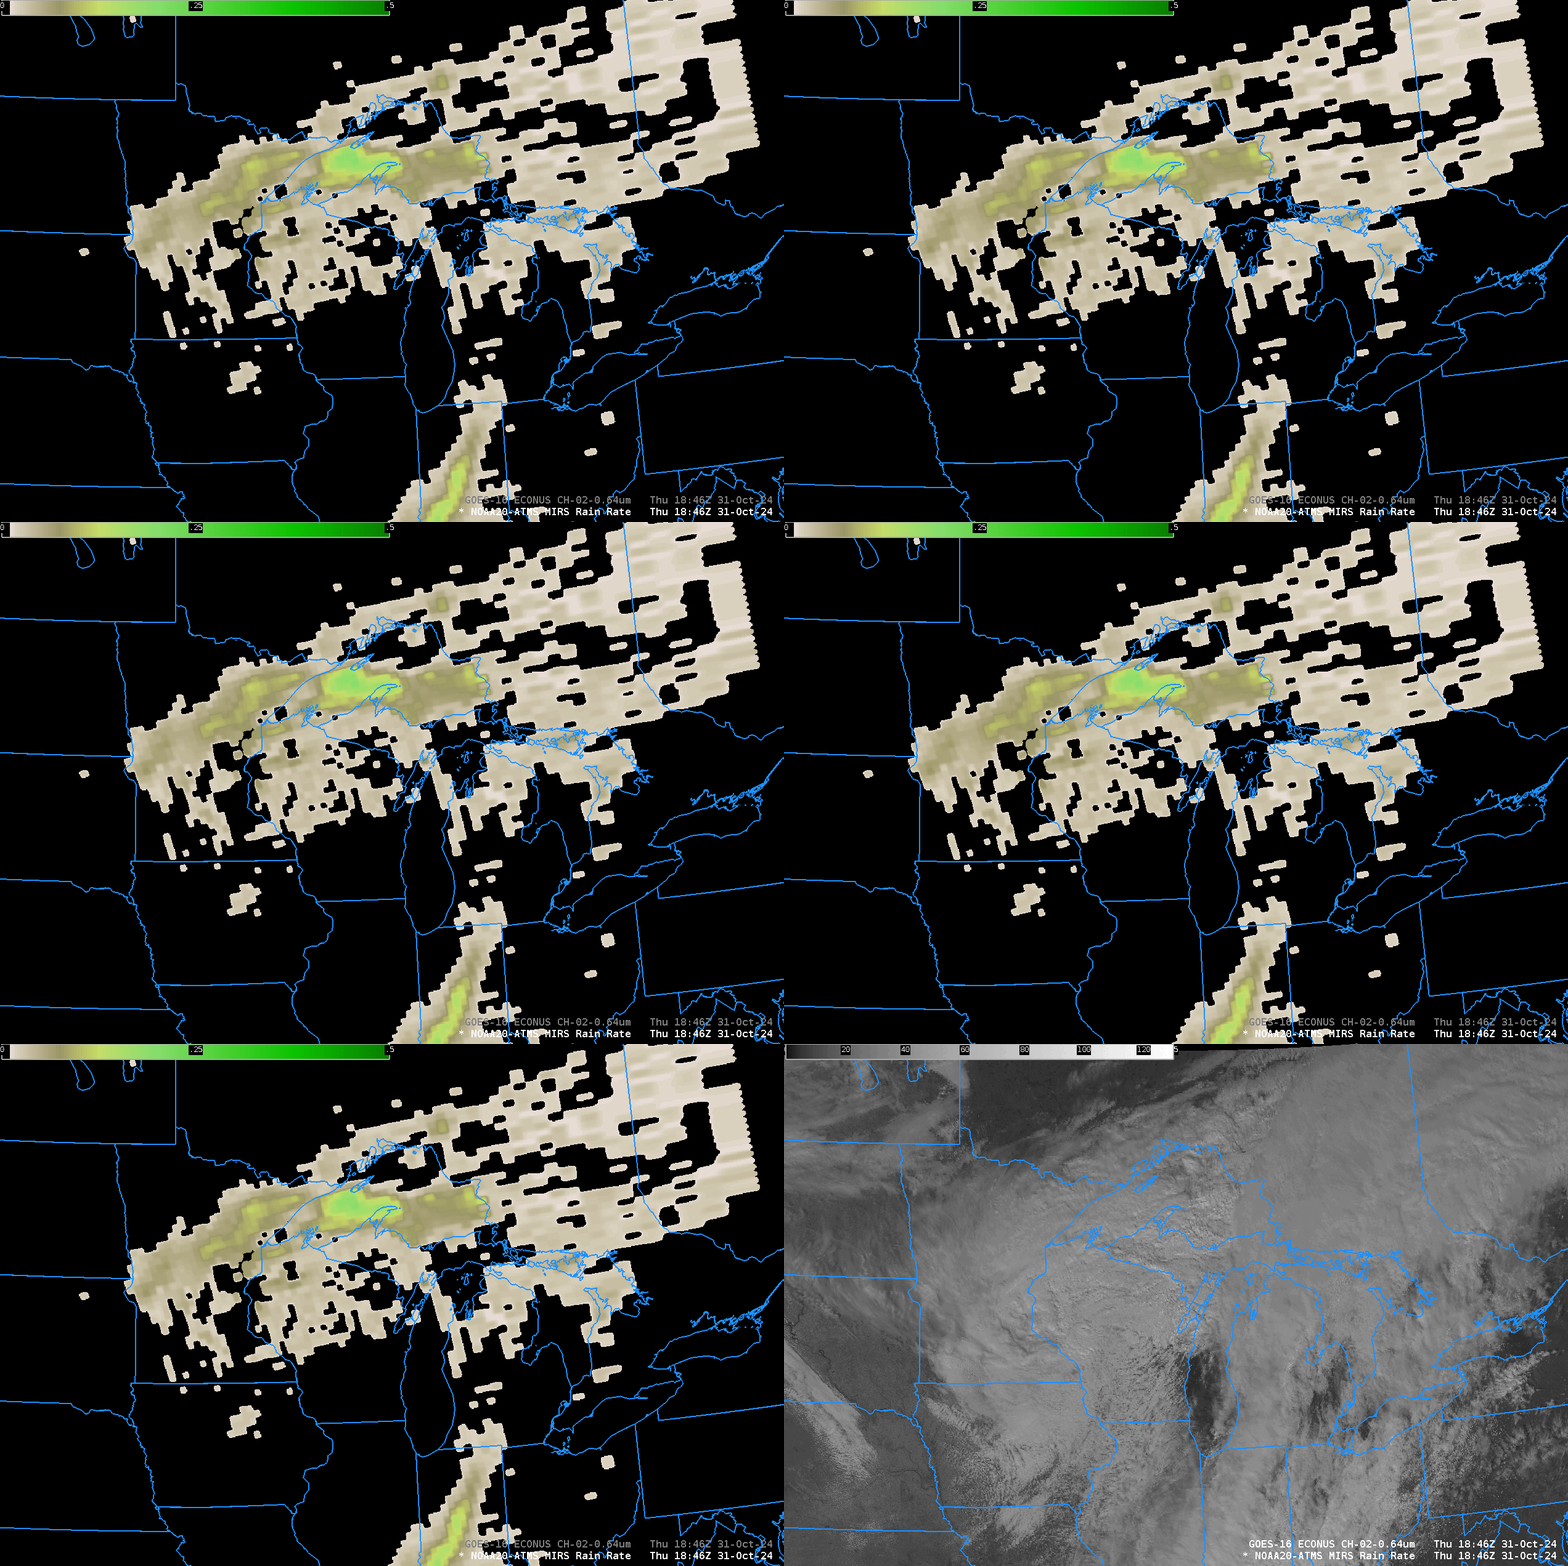
GOES Imagery with its excellent temporal resolution is what a forecaster is going to use to monitor the evolution of a system. Polar Orbiter data offers unique fields that aren’t really available from basic GOES imagery. Suomi-NPP overflew the region and Microwave-derived estimates of rain rate are shown below (the data are mislabeled as coming from NOAA-20) in a toggle with various GOES-16 bands at the same time. The band of heavier precipitation is associated with strong low-level frontogenesis (here is a 12-h NAM forecast of 700-mb Frontogenesis — source — at 1800 UTC on 31 October). In the toggle below, one of the Band 13 images has been rescaled to allow the display to use the entire color bar. It is time to make that adjustment in the upper midwest as very cold cloud tops that accompany strong convection are not likely until next Spring!
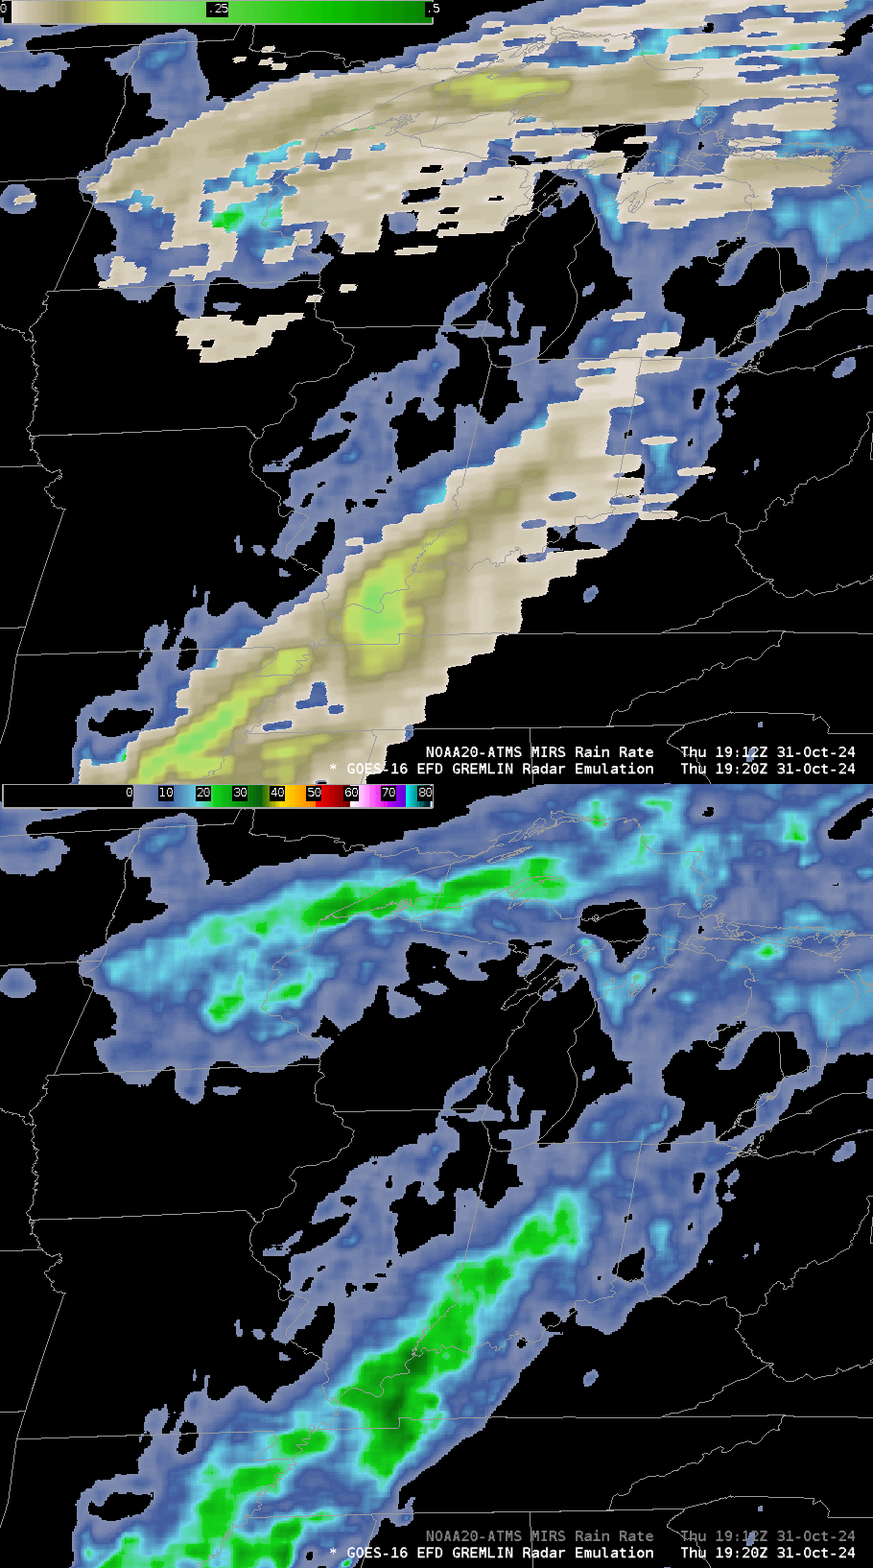
GOES data can also be used to estimate rain rate. In addition to the level 2 rain rate product, GREMLIN (GOES Radar Estimation via Machine Learning to Inform Numerical Modeling), which field is shown below in a toggle with ATMS estimates of Rain Rate from NOAA-20 (as labeled this time), is available. There is excellent agreement between the two estimates especially regions of heavier precipitation.
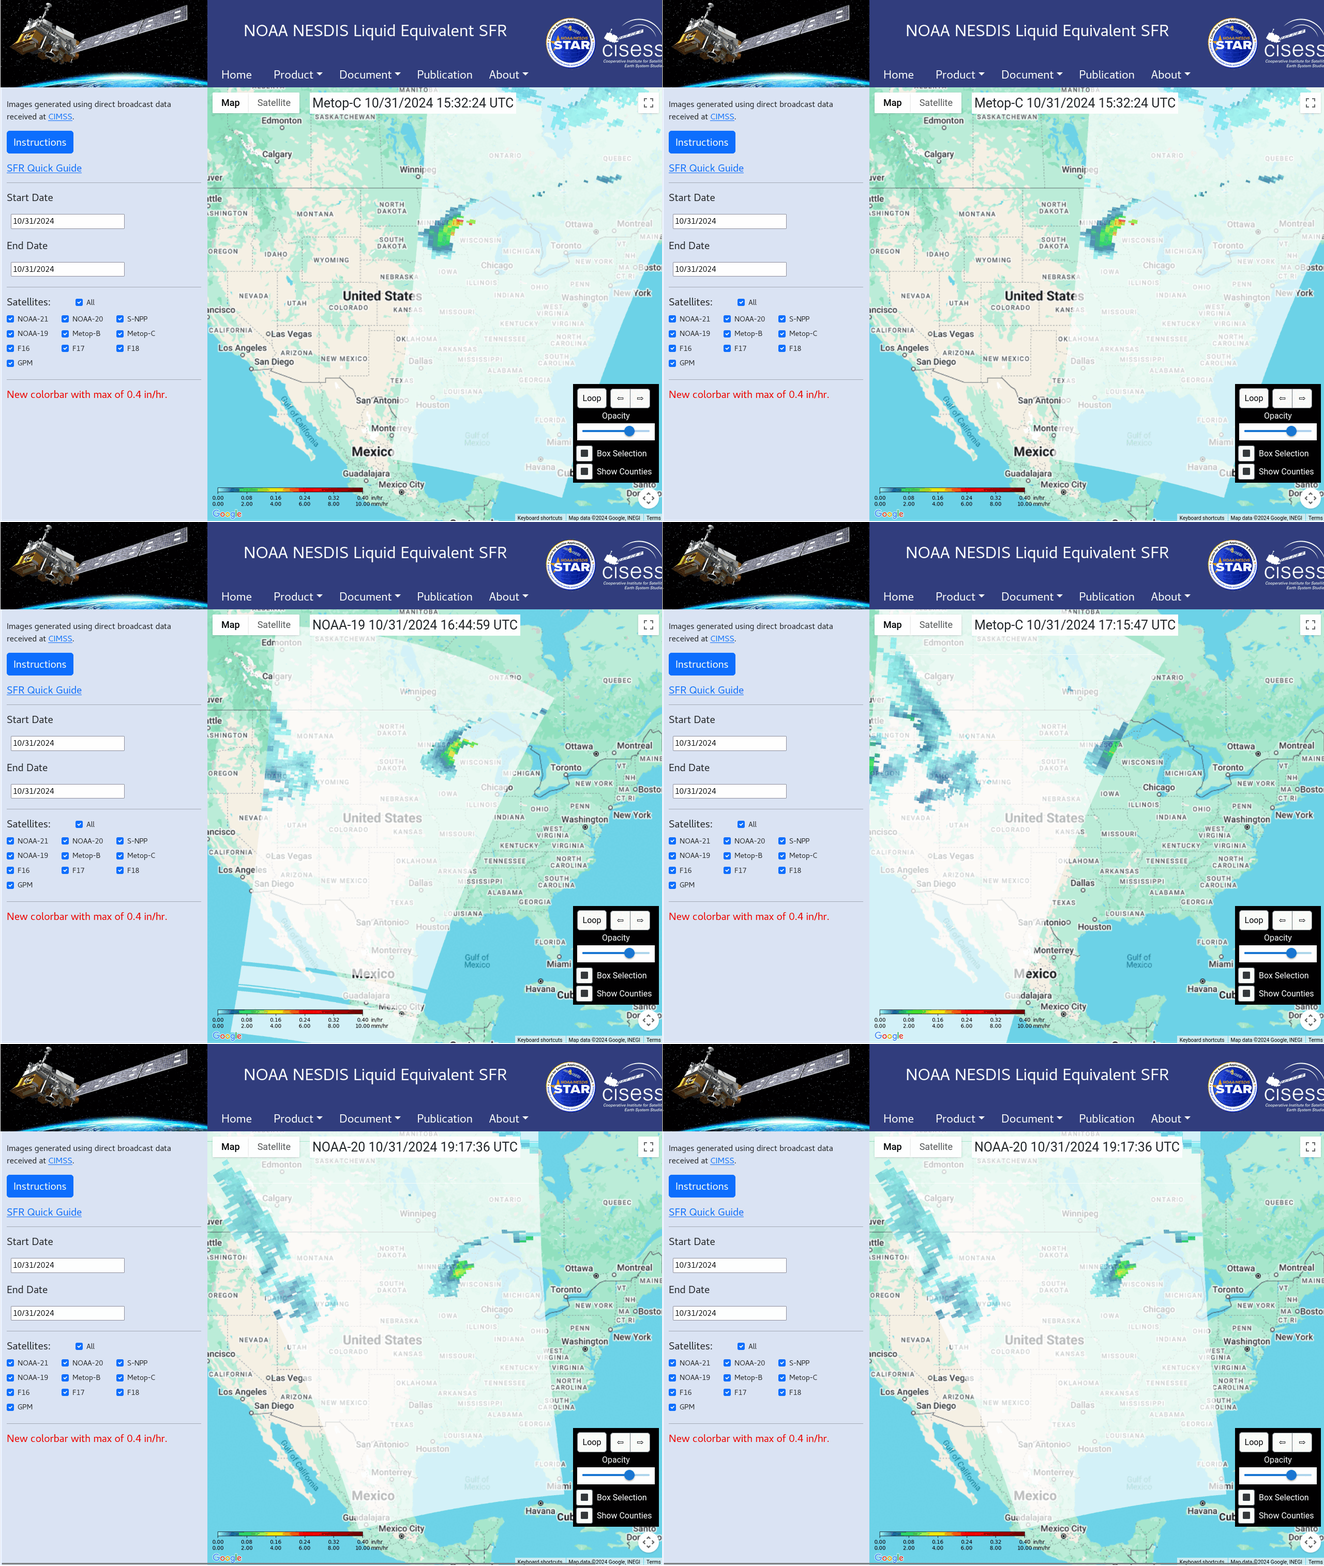
Microwave data can also give snowfall estimates, as displayed at this website. Estimates from a variety of Low Earth Orbit (LEO) satellites that have Microwave Sounders on board are shown below for times between 1500 and 1900 UTC on 31 October 2024.
—————
Free Secure Email – Transcom Sigma
Transcom Hosting
Transcom Premium Domains
