NUCAPS estimates of stability and moisture in the South Pacific

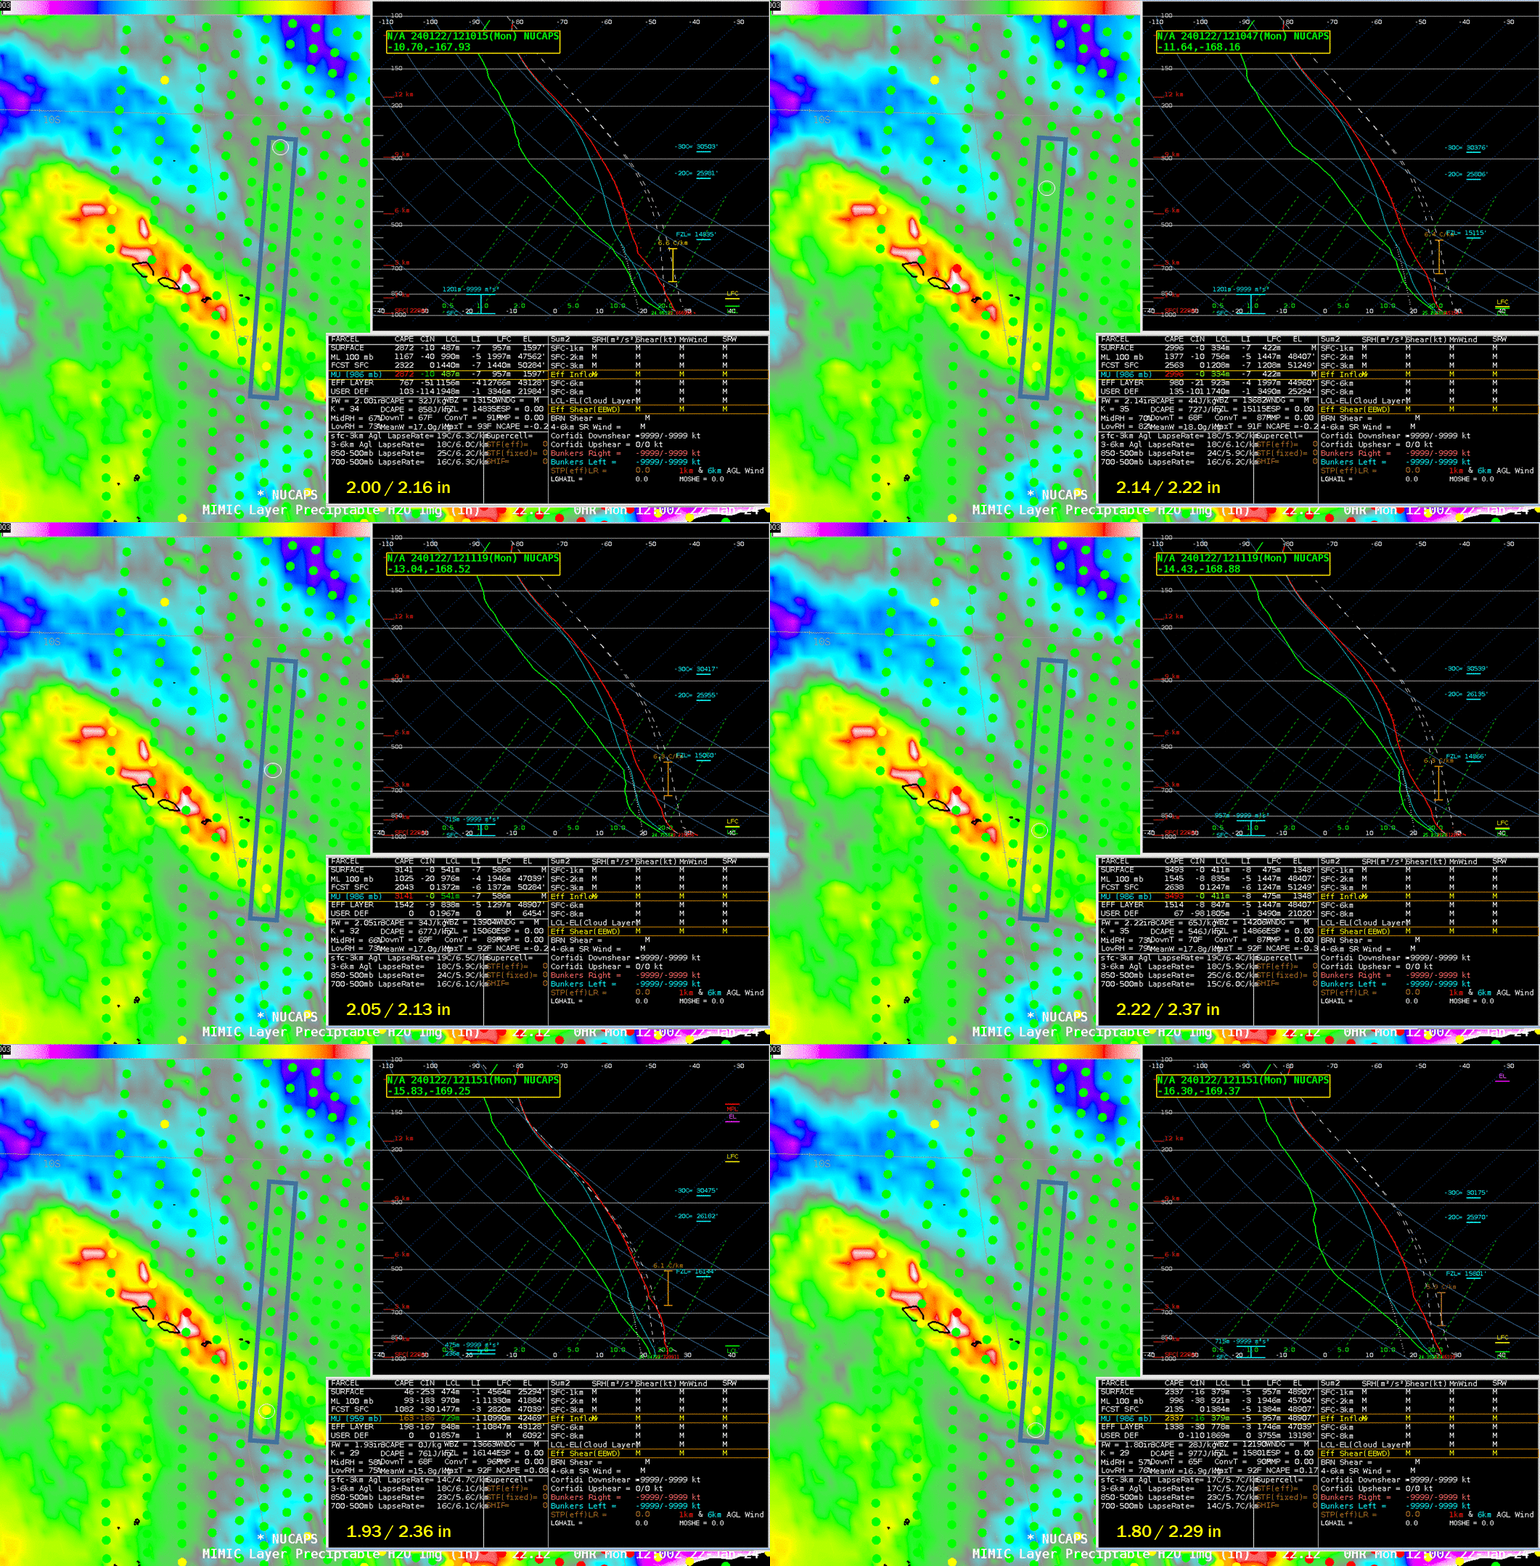
NOAA-20 overflew the Samoan islands shortly after 1200 UTC on 22 January 2024, as shown above. The animation displays a series of 13 profiles and derived parameters to the east of American Samoa and Samoa. with locations as indicated by the circle. Most Unstable CAPE values derived from the profiles all are derived from the near-surface 986 mb — except for the profile location denoted in yellow, which has a MUCAPE level at 959 mb. That point also has the smallest value of MUCAPE: <200; Other values range from 2200 to as high as 4400. NUCAPS profiles are a useful source of thermodynamic information (independent of models) in regions where data are lacking.
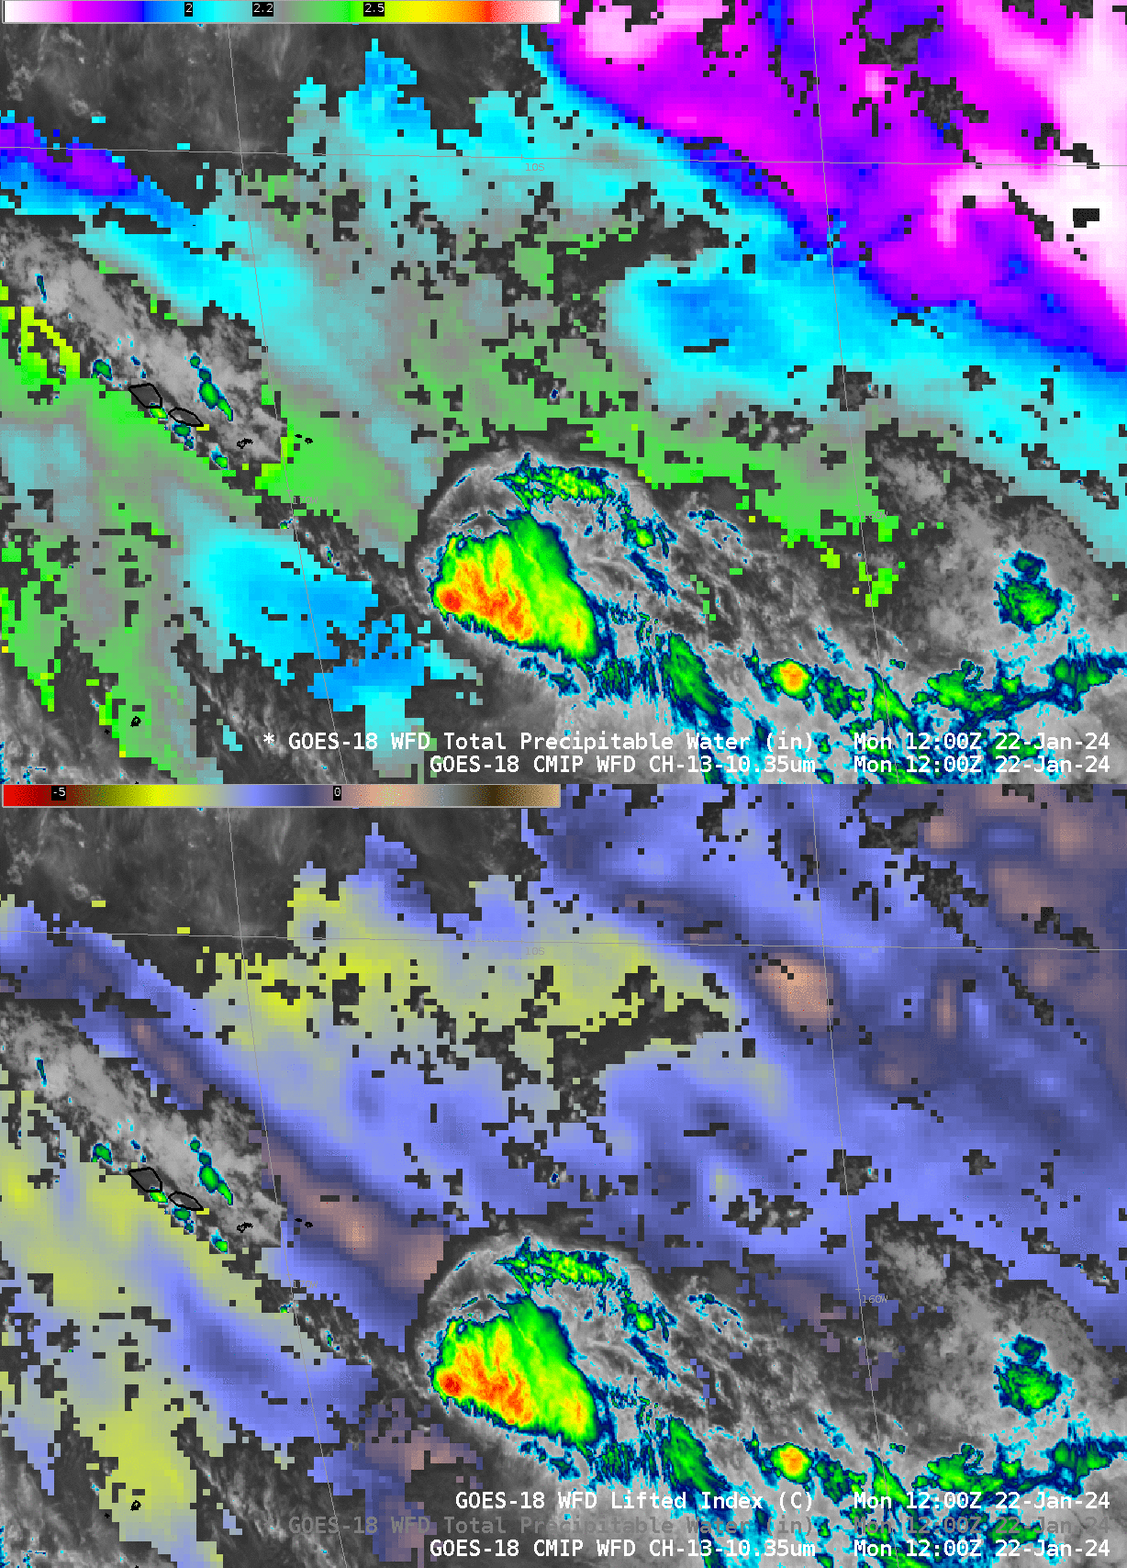
GOES-18 also viewed this region, and the toggle below compares derived Total Precipitable Water and Lifted Index at 1200 UTC, the approximate time of the NOAA-20 overpass. The TPW shown below shows structures and values similar to the MIMIC TPW shown above. A careful observer will also see the convection below associated with the red NUCAPS sounding availability point above (many red points associated with the large convective complex near 17o S, 166.5o W are hidden in the figure above, but are viewable here). GOES Level 2 products are able to highlight relatively small-scale variability in moisture/stability (for example, the region of relatively stable air stretching southeast to northwest — tannish brown in the LI color enhancement — to east and north of the Samoan Islands. Use them in concert with NUCAPS fields (available in all sky conditions) to get a good feel of the moisture distribution in data-poor regions.

Important NUCAPS note: NOAA-21 NUCAPS profiles are scheduled to flow via SBN to NWS forecast offices in February. At present, they will augment (not replace) NOAA-20 profiles, allowing forecasters to see short-term trends in NUCAPS fields.
—————
Free Secure Email – Transcom Sigma
Transcom Hosting
Transcom Premium Domains
