
Microwave and infrared estimates of rainfall

In regions without radar, satellite estimates of rainfall intensity are vital in understanding precipitation. Microwave estimates have an advantage in that microwave energy is not strongly affected by clouds, so the internal structure of the cloud that can affect rainfall distribution can be detected. (However, microwave data has poorer spatial resolution than infrared.) Rain Rates shown above are generally less than 1″/hour. Microwave estimates do require a knowledge of the surface emissivity. Over the ocean, that emissivity is fairly well-known. Microwave rainfall estimates above show no rainfall along the coast of southern/eastern New England, an artifact, perhaps, of changes in the surface emissivity estimates that is affecting the Rain Rate algorithm. The GsMap site (from Japan’s JAXA), shows computed rain rate as well, using a variety of satellite sources. The toggle below compares the 0600-0659 and 0700-0759 UTC estimates on 10 January, bracketing the observation above (derived, incidentally, from data downloaded at the Direct Broadcast antenna at CIMSS and processed using CSPP software). The 0700-0759 UTC image does a much better job of matching the 0622 UTC Rain Rate shown above. Values off the east coast of the US are 10-15 mm/hour. The region of missing data along the coast is absent.
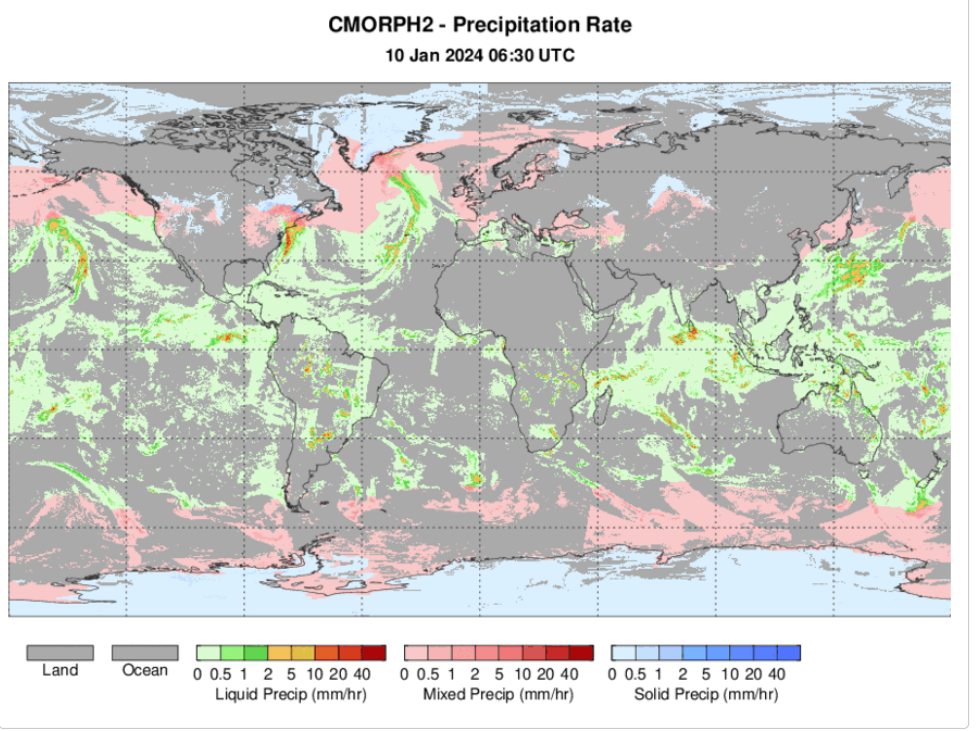
NOAA produces CMORPH2 estimates of precipitation as well, available at this website. The image below shows a screen-capture of rain rate at 0630 UTC on 10 January 2024. A zoomed-out view, it nevertheless shows the heaviest precipitation is offshore.
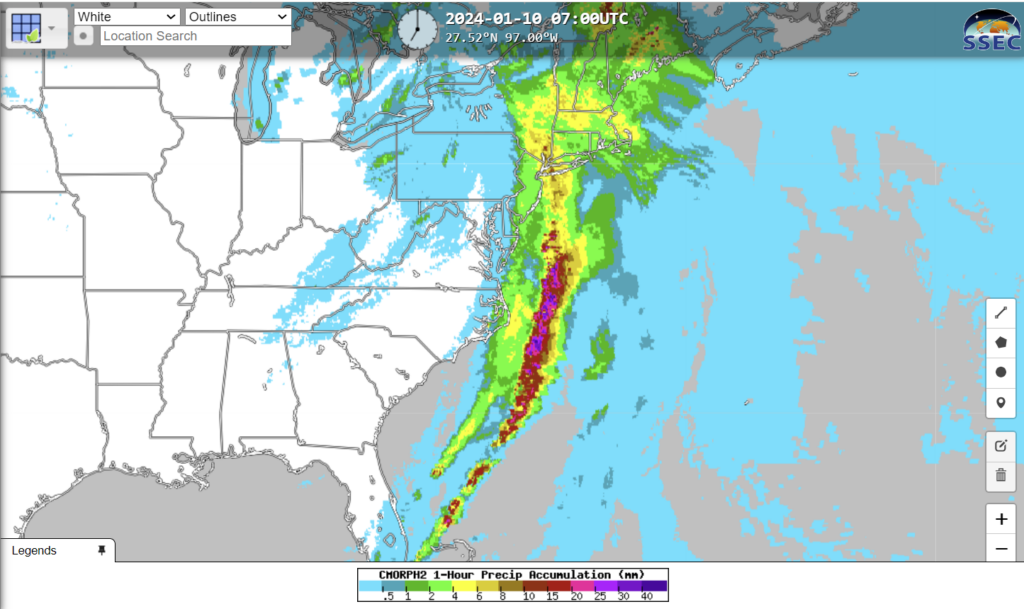
CMORPH2 is also available at RealEarth (link — then enter ‘CMORPH2’ in the Search Box). 1-hour precipitation rates 10-25 mm/hour are shown (25 mm/hr, of course, is 1 inch/hour)
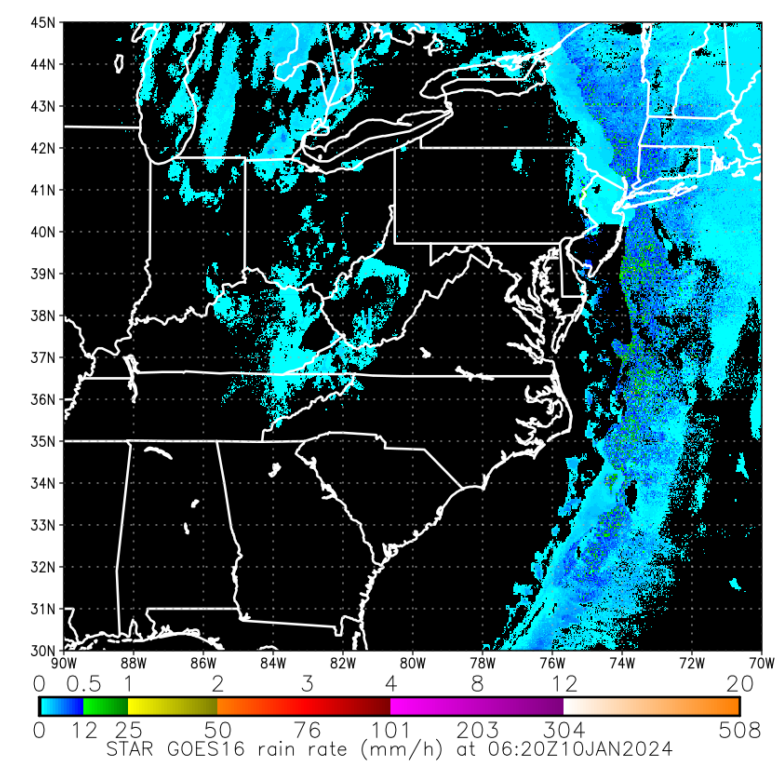
GOES-R data are also used to create Rain Rate estimates, and the estimate from 0620 UTC, below, shows the original GOES-R algorithm output. Close inspection of the field will show a correlation with the cold cloud tops. However, the product algorithm has been modified considerably in the past five years, and output from the new ‘Enterprise’ algorithm (courtesy Bob Kuligowski, NOAA), not yet implemented in AWIPS, is shown at bottom. The Enterprise algorithm shows much less of a relationship with the very cold cloud tops, in agreement with the microwave estimates above.
—————
Free Secure Email – Transcom Sigma
Transcom Hosting
Transcom Premium Domains