MetopC NUCAPS profiles are now in AWIPS
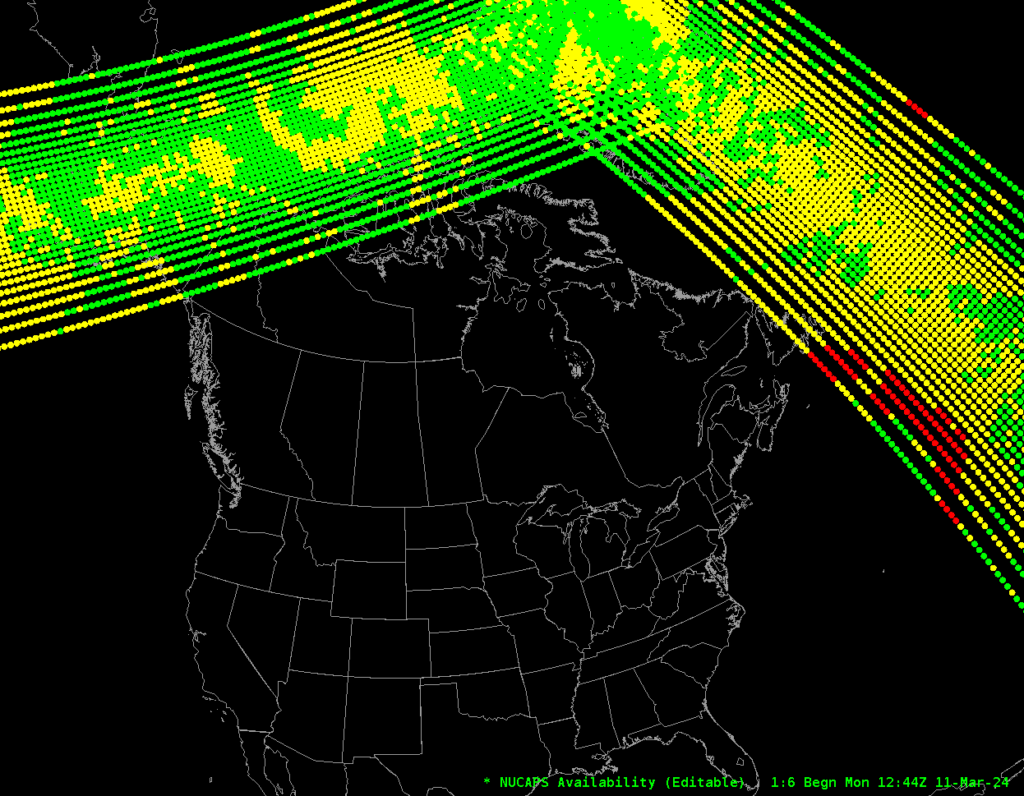
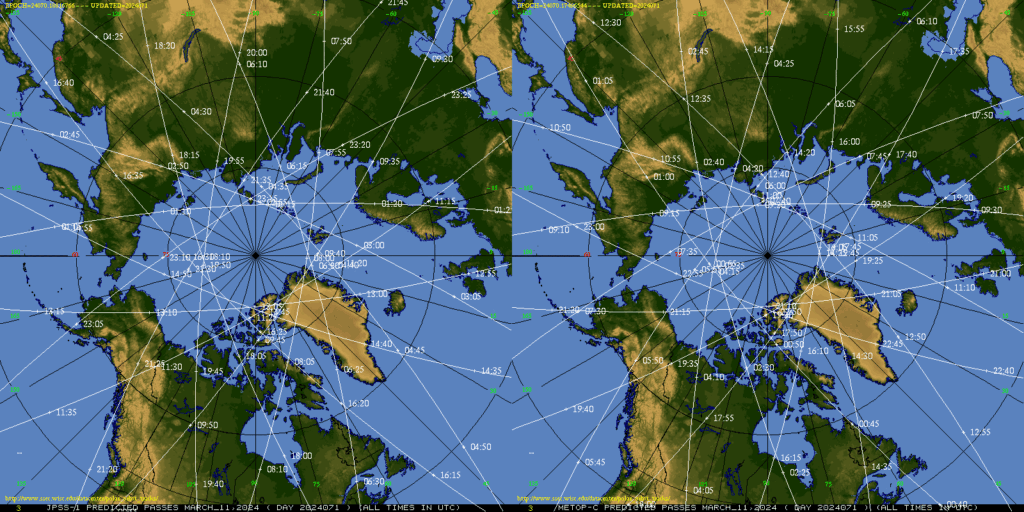
MetopC IASI and MHS/AMSU data are used to create NUCAPS profiles and that thermodynamic profiles are now flowing into AWIPS, as shown in the screen capture above that shows a NOAA-20 swath extending from Greenland to Alaska at about the same time as a MetopC swath that extends from the Atlantic to Greenland. The NOAA-20 and MetopC orbits are shown below (from this site). The NOAA-20 orbit stretches from Scotland (at 1255 UTC) to the Aleutians (1315 UTC); The MetopC orbit is from the Arctic Ocean north of Scandanavia (about 1245 UTC) to the western Atlantic (around 1255 UTC).
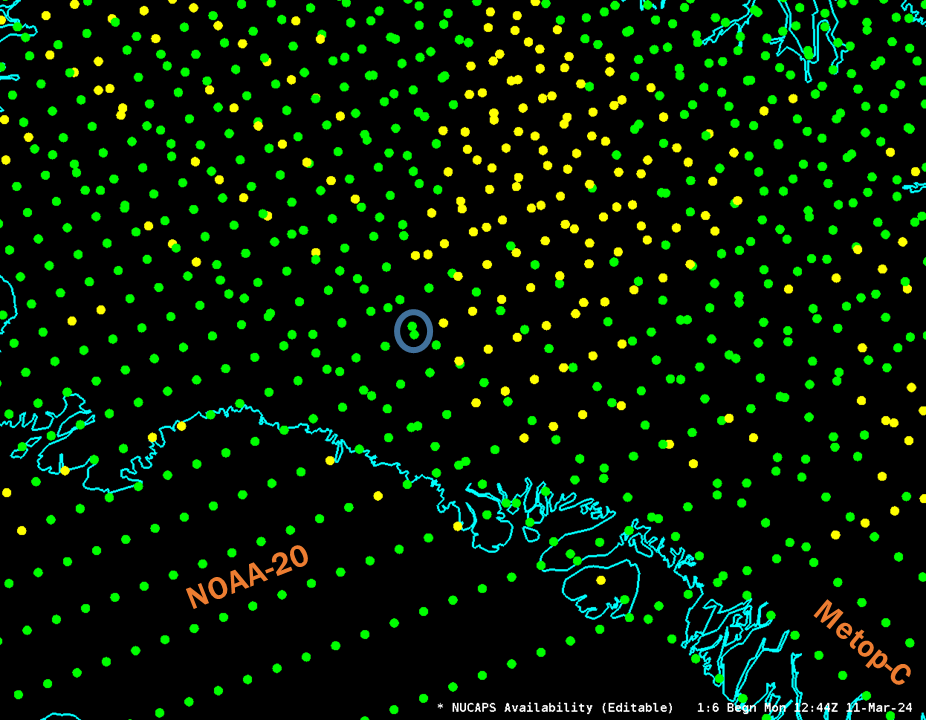
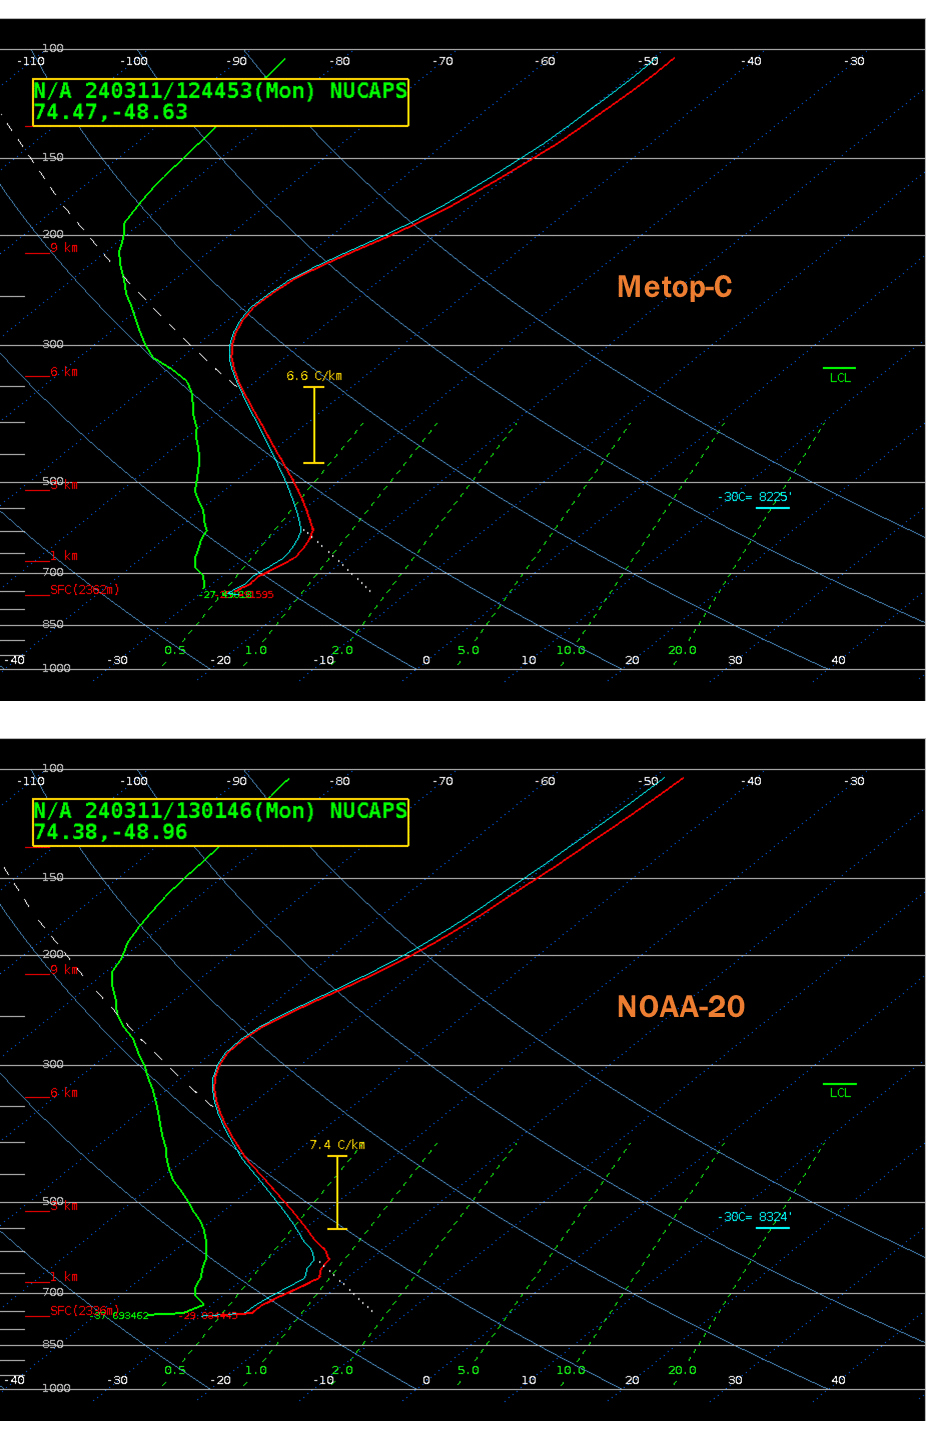
A power of NUCAPS from multiple satellites at higher latitudes is shown below. Over western Greenland, NOAA-20 and MetopC have sampled the same atmosphere at nearly the same time. What do those two points circled in blue show (the southernmost one is from NOAA-20, the northernmost from MetopC). That is shown below.
At lower latitudes (over CONUS for example), the power of a second satellite means that earlier observations occur. MetopC orbits (here) and NOAA-20 orbits (here) over CONUS on 11 March show an east-coast pass at 1440 UTC (MetopC) and then one at 1755 UTC (NOAA-20); a central US pass at 1620 UTC (MetopC) and then one at 1935 UTC (NOAA-20); and a west coast pass at 1800 UTC (MetopC) and then one at 2120 UTC (NOAA-20). Thus, the temporal change of the atmosphere is more easily monitored.
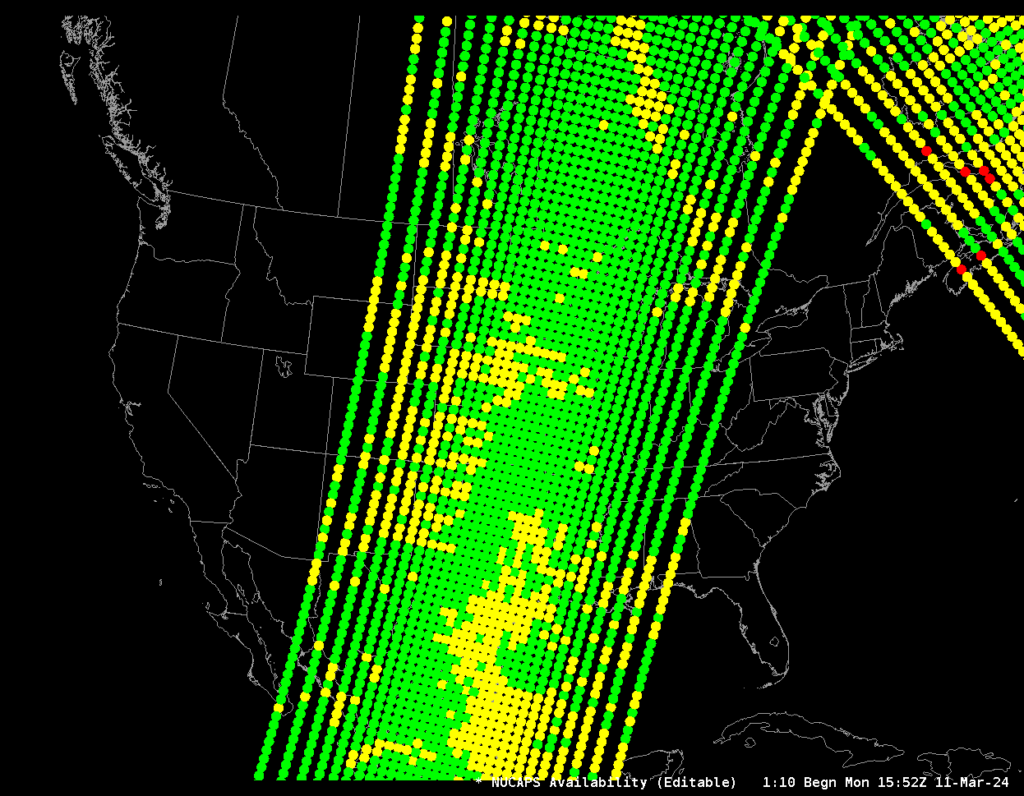
Sounding availability at 1552 UTC is shown below. NUCAPS profiles over central North America are from MetopC. NUCAPS profiles over Atlantic Canada are from NOAA-20.
—————
Free Secure Email – Transcom Sigma
Transcom Hosting
Transcom Premium Domains
