
Long-duration Tehuano wind event

True Color RGB images from GOES-18 (left) and GOES-16 (right), during the daytime hours on 27-30 January [click to play MP4 animation]
GOES-18 (GOES-West) and GOES-16 (GOES-East) True Color RGB images from the CSPP GeoSphere site (above) showed hazy plumes of blowing dust lofted by Tehuano gap winds that emerged from the south coast of Mexico — which spread out across the Gulf of Tehuantepec and the adjacent waters of the Pacific Ocean on 27-30 January 2024 (long, narrow rope clouds delineated portions of the gap wind boundary on 28/29/30 January). Most Tehuantepec Wind events tend to last 24 or perhaps 48 hours — so the 3+ day duration of this particular episode was fairly unusual.
GOES-16 “Red” Visible (0.64 µm) images on 30 January (below) included plots of Metop ASCAT winds (with several red Gale Force wind vectors over the Gulf of Tehuantepec) and plots of surface/buoy/ship reports (with notable ship reports of 35 knot winds at 1400 UTC, and Blowing Dust at 1800 UTC). The cold front responsible for this Tehuano wind event moved rapidly southward across the western Gulf of Mexico and entered the Isthmus of Tehuantepec on 27 January (surface analyses) — and reached its southernmost position across southern Nicaragua on 30 January.
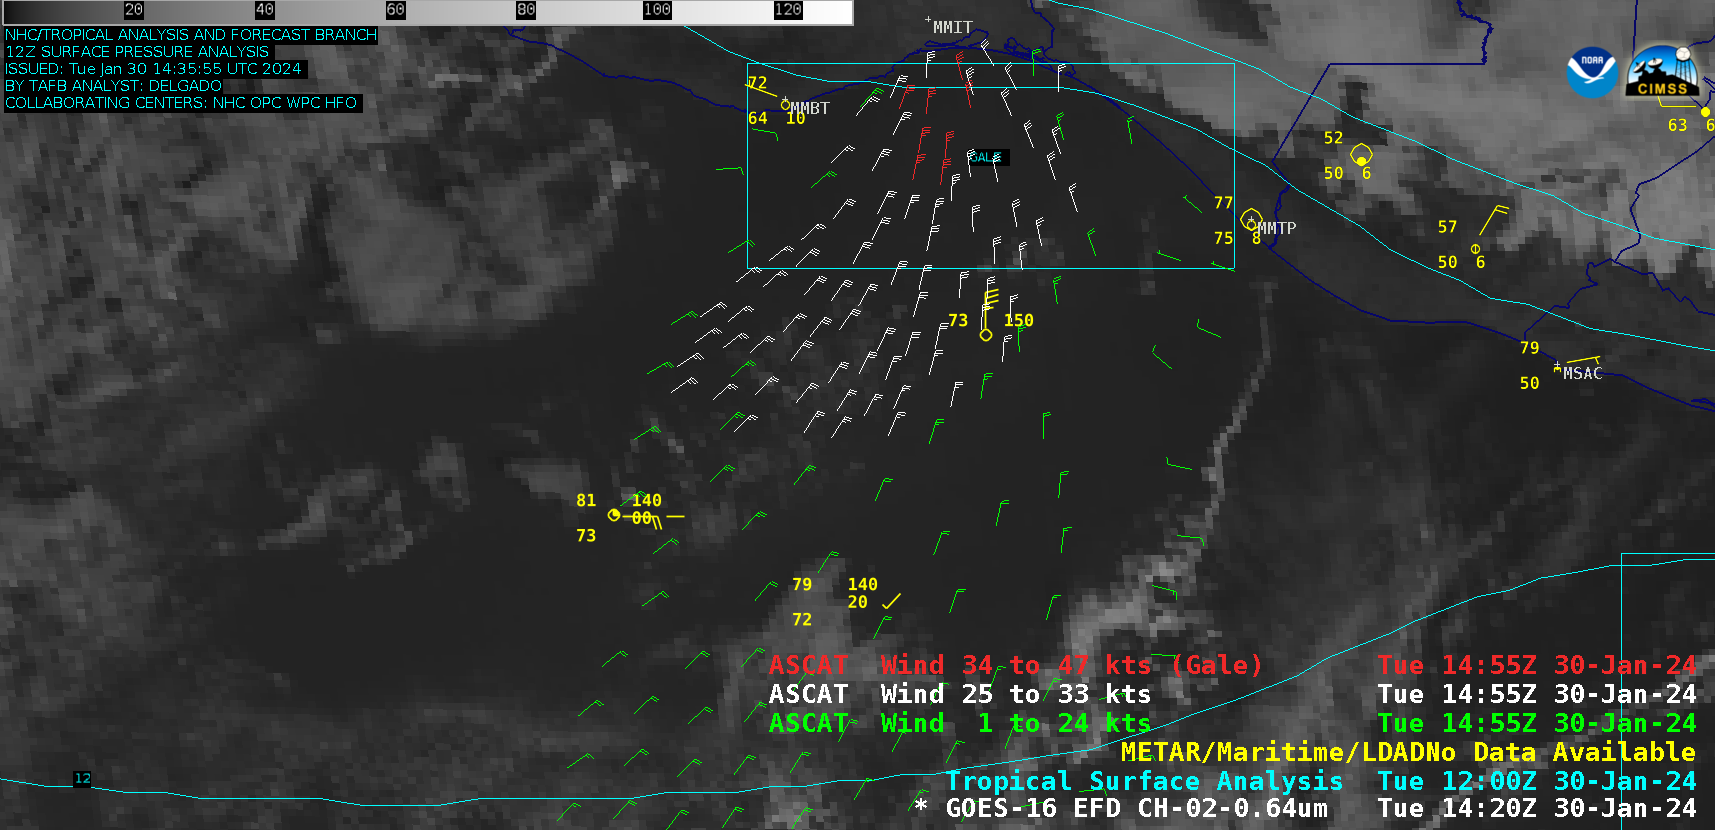
GOES-16 “Red” Visible (0.64 µm) images, from 1320-2350 UTC on 30 January [click to play animated GIF | MP4]
GOES-16 “Red” Visible (0.64 µm) images with an overlay of the Dust Detection derived product at 4 different times from 28-30 January (below) showed examples of Medium Confidence dust detection.
GOES-16 “Red” Visible (0.64 µm) images, with an overlay of the Dust Detection derived product at 4 different times from 28-30 January [click to play animated GIF |
Surface wind speeds derived using Metop-B/C ASCAT and GCOM-W1 AMSR2 data (source) showed portions of the Tehuano wind field as it spread out across the Gulf of Tehuantepec and the Pacific Ocean during 28-30 January (below).
ASCAT scatterometer winds from Metop-B and Metop-C, from 1615 UTC on 28 January to 1622 UTC on 30 January
AMSR2 wind speeds from GCOM-W1, from 0748 UTC on 28 January to 2001 UTC on 30 January
As a result of the strong gap wind flow, Significant Wave Heights derived from Jason-3 on 29 January and Sentinel-3A on 30 January (below) reached maximum values of 13-17 ft.
Significant Wave Heights derived from Jason-3 on 29 January and Sentinel-3A on 30 January
—————
Free Secure Email – Transcom Sigma
Transcom Hosting
Transcom Premium Domains