LightningCast probability with a High Plains blizzard
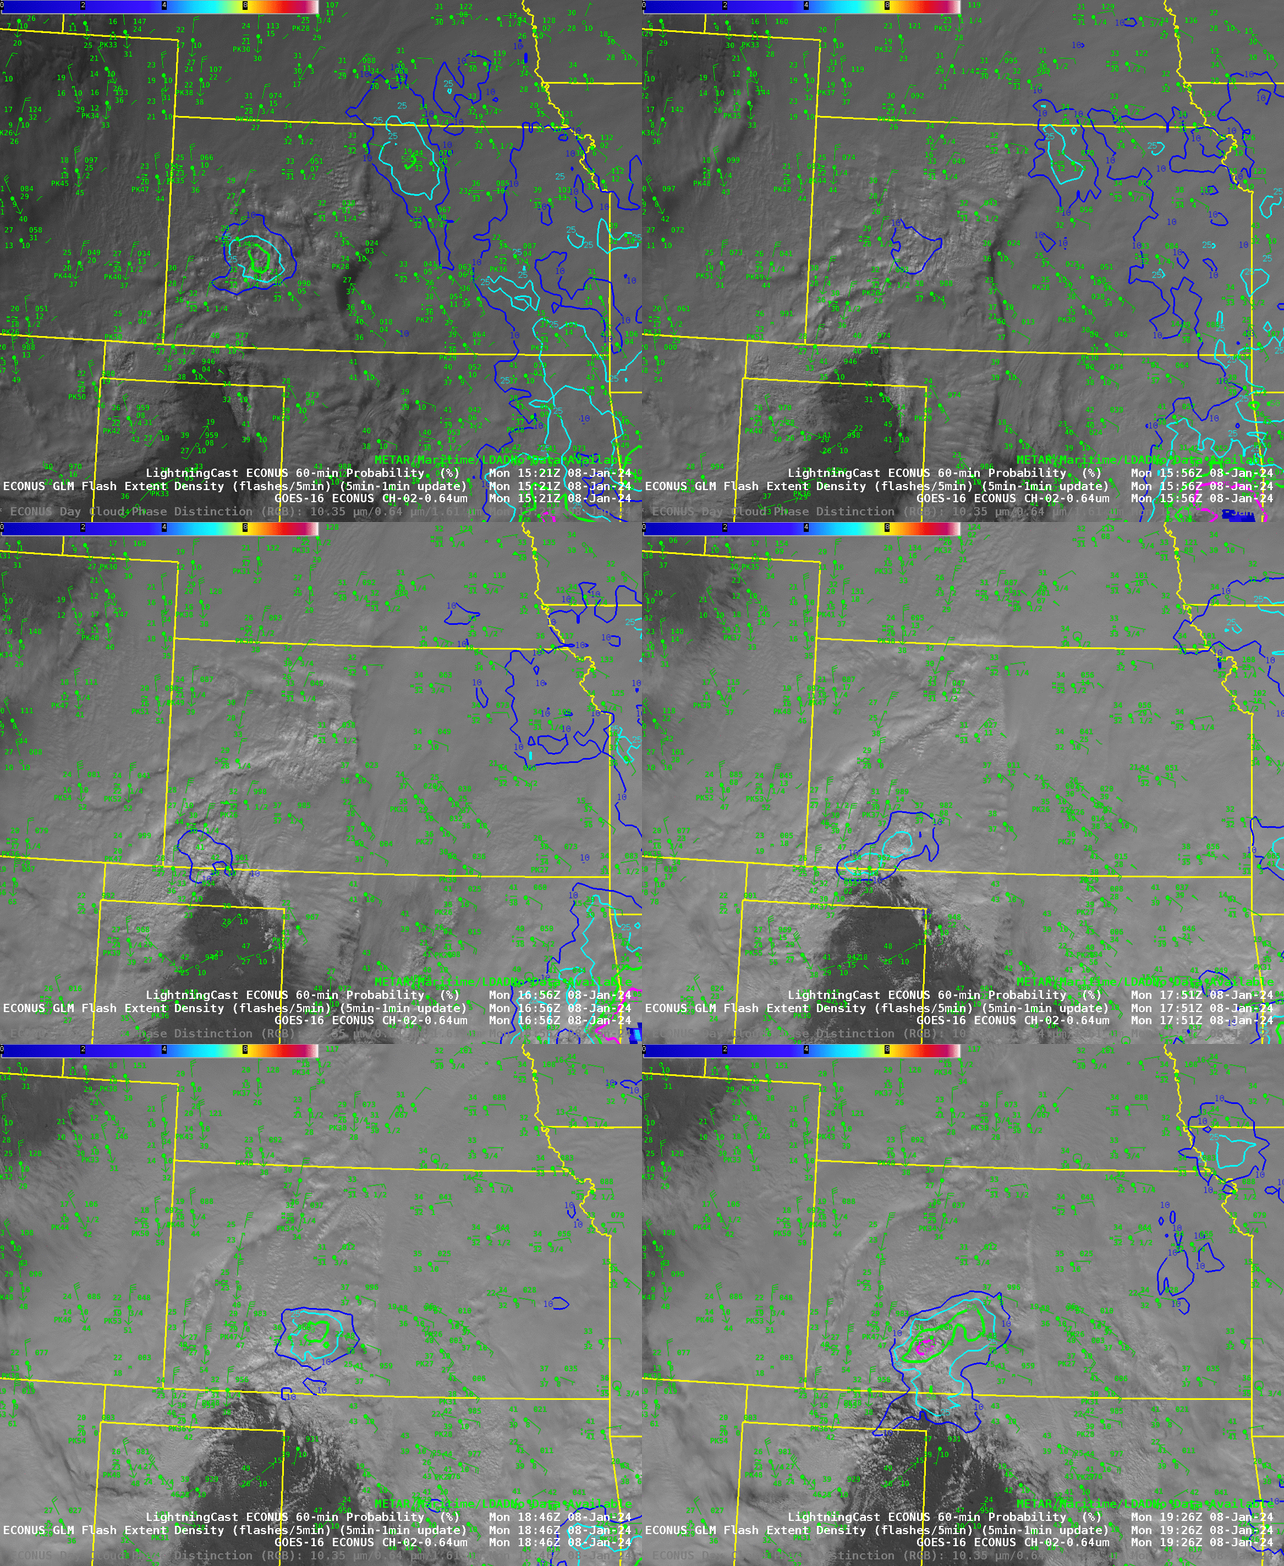
Blizzard warning were hoisted over the high plains of Kansas, Nebraska, New Mexico, Texas and Oklahoma for a strong storm on 8 January 2024 (image from the weather.gov website). The animation above shows visible imagery overlain with LightningCast probabilities centered over Kansas. Convection occurring over the cold aid will lead to increased snowfall rates, worsening local conditions (as if northerly winds of 30-40 knots weren’t enough!). LightningCast probabilities (that suggest where GLM observations within the next 60 minutes are most likely) give an advance warning of where conditions might be the worst in the short term. Note that Flash Extent Density values are scaled in the imagery from 1-15 vs. the default of 1-260.
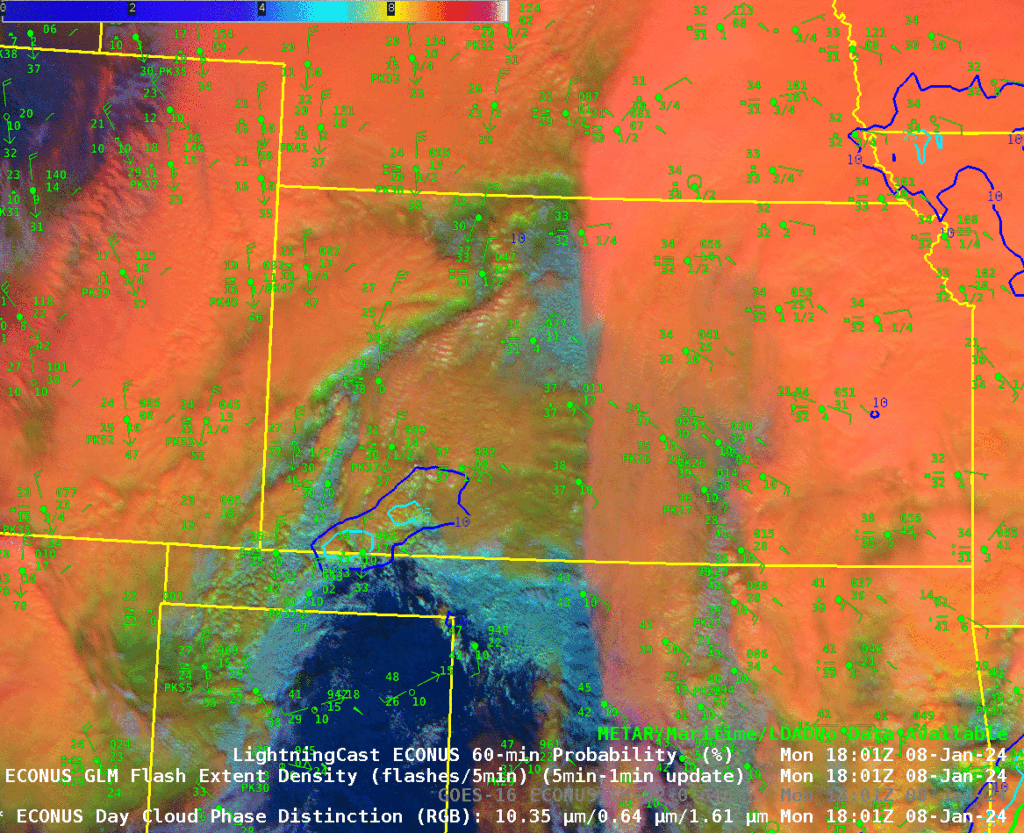
LightningCast is available online here. LightningCast is a tool created via machine learning that uses ABI Bands 2, 5, 13 and 15 (0.64 µm, 1.61 µm, 10.3 µm and 12.3 µm, repsectively) to ascertain the lightning probabilities. Band 2, 5 and 13 are also the components of the Day Cloud Phase Distinction RGB, and a 1-hour animation, 1801-1901 UTC, of that field, overlain with LightningCast probability and GLM observations is shown below. It’s hard to tease the information in LightningCast from the Day Cloud Phase distinction RGB.
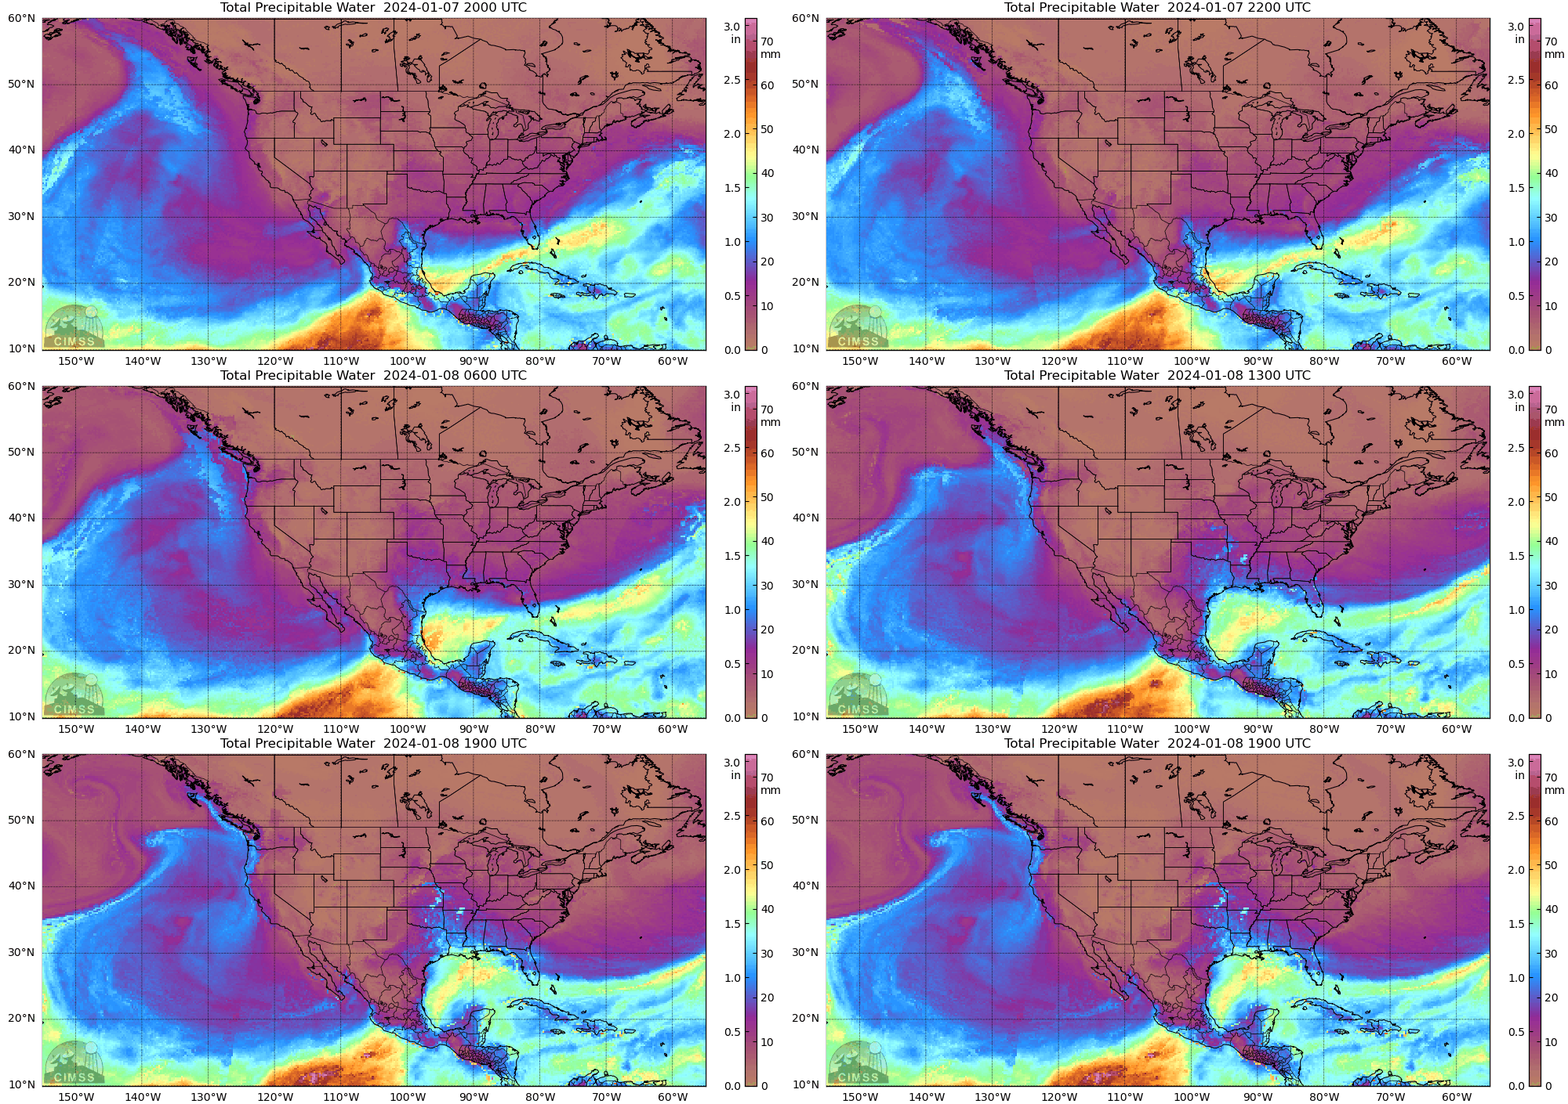
MIMIC Total Precipitable Water fields, below, for the 24 hours ending 1900 UTC on 8 January 2024, show how the large-scale circulation is drawing moisture northward out of the Gulf of Mexico.
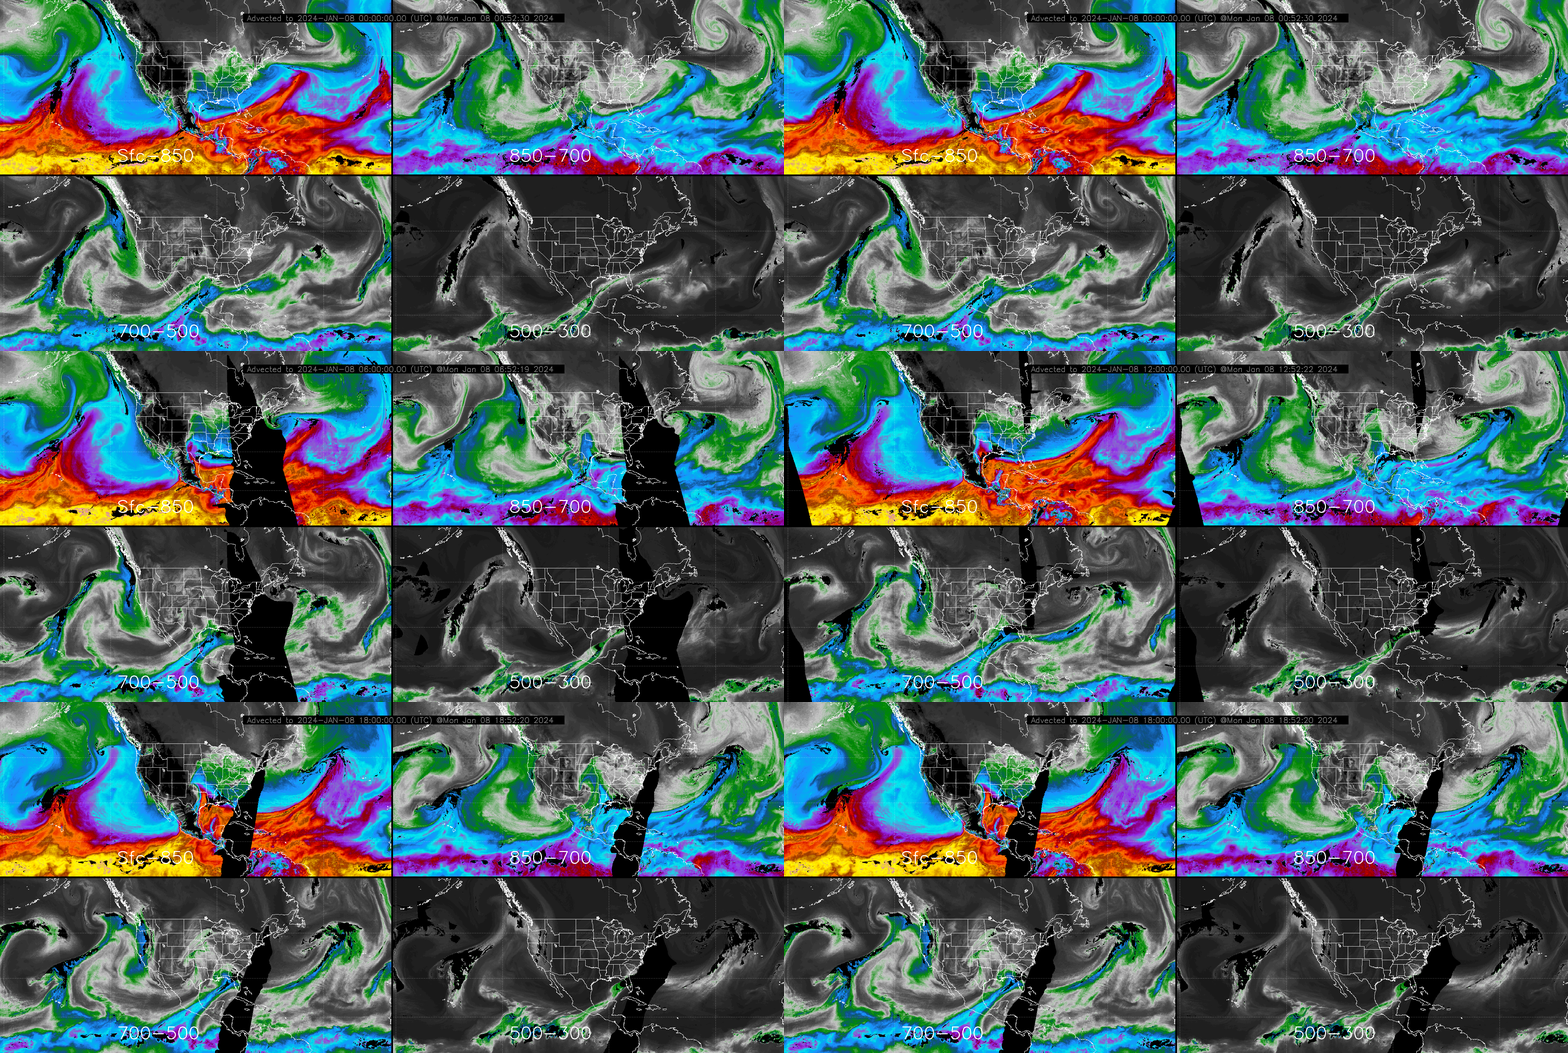
The large-scale circulation is also apparent in the Advected Layer Precipitable Water (ALPW) fields, below. (source) Data for the different layers suggest that moisture transport is most apparent below 500 mb.
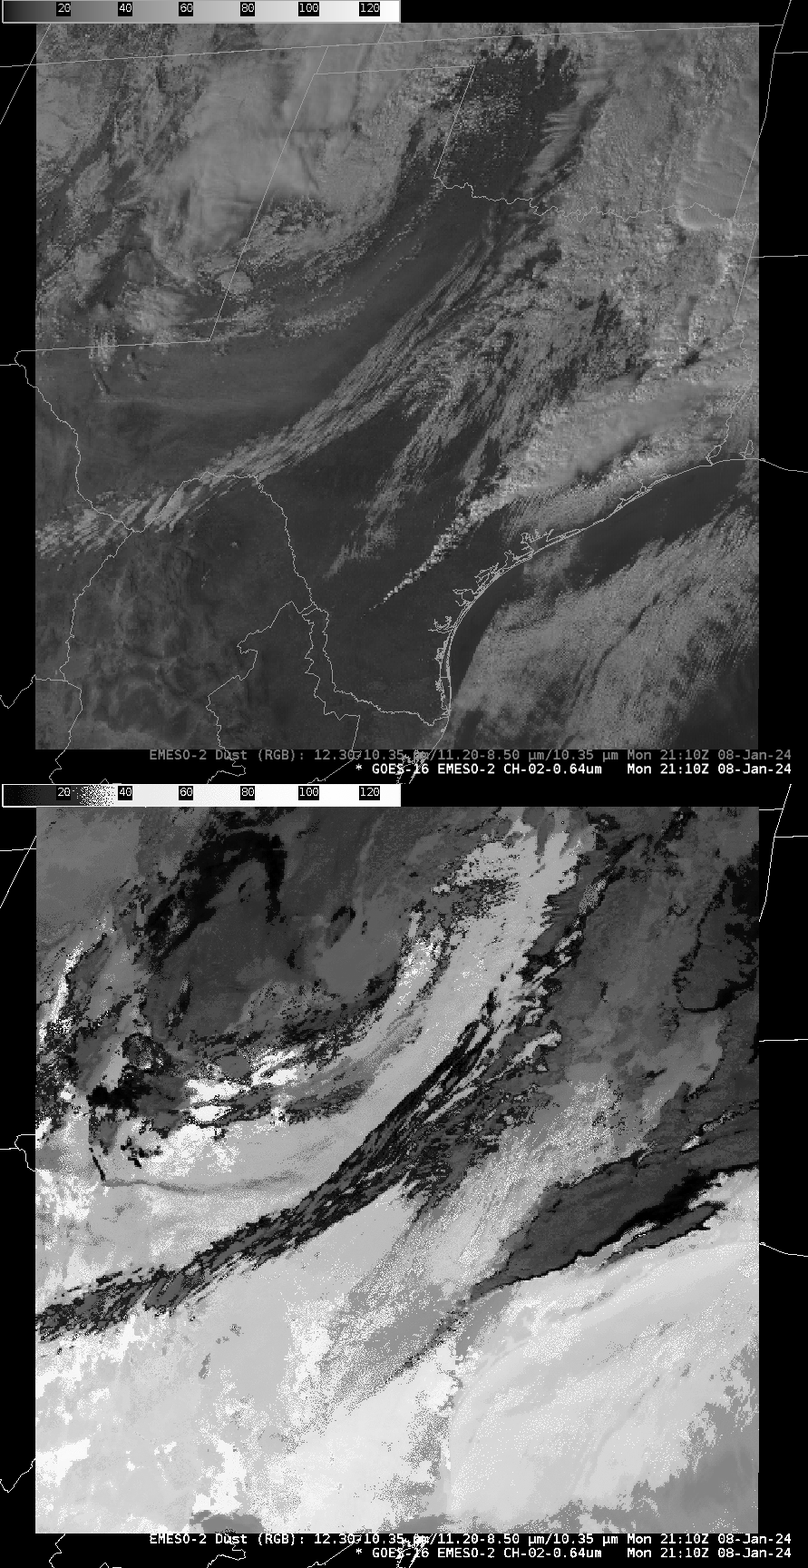
As is frequently the case with strong storms over the Southern Plains, strong surface winds on the south side of the storm have lofted dust, as shown in the toggle below between Visible and Dust RGB imagery at 2110 UTC on 8 January 2024 (available here as well). The pink/magenta enhancement in this RGB shows where dust is detected.
—————
Free Secure Email – Transcom Sigma
Transcom Hosting
Transcom Premium Domains
