GOES-18 Level 2 Products over American Samoa
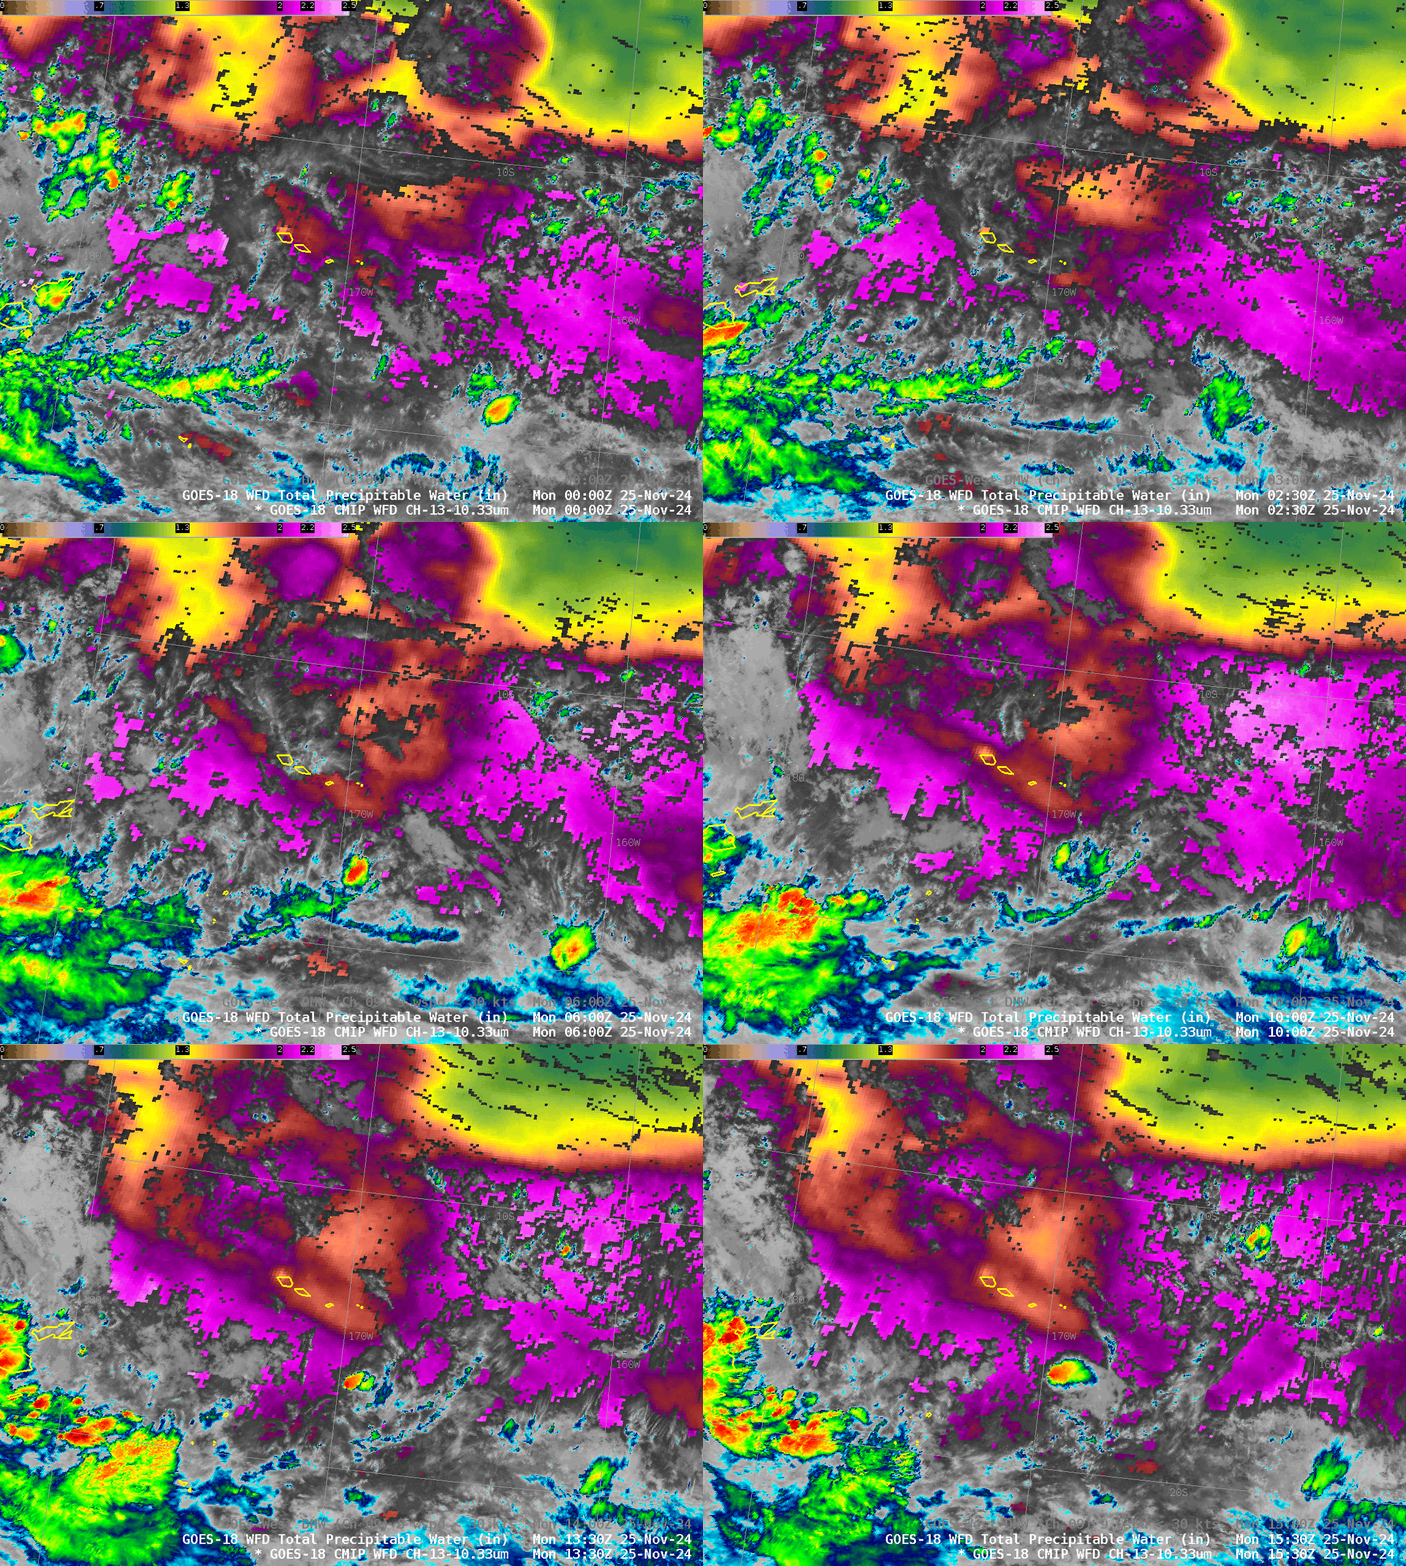
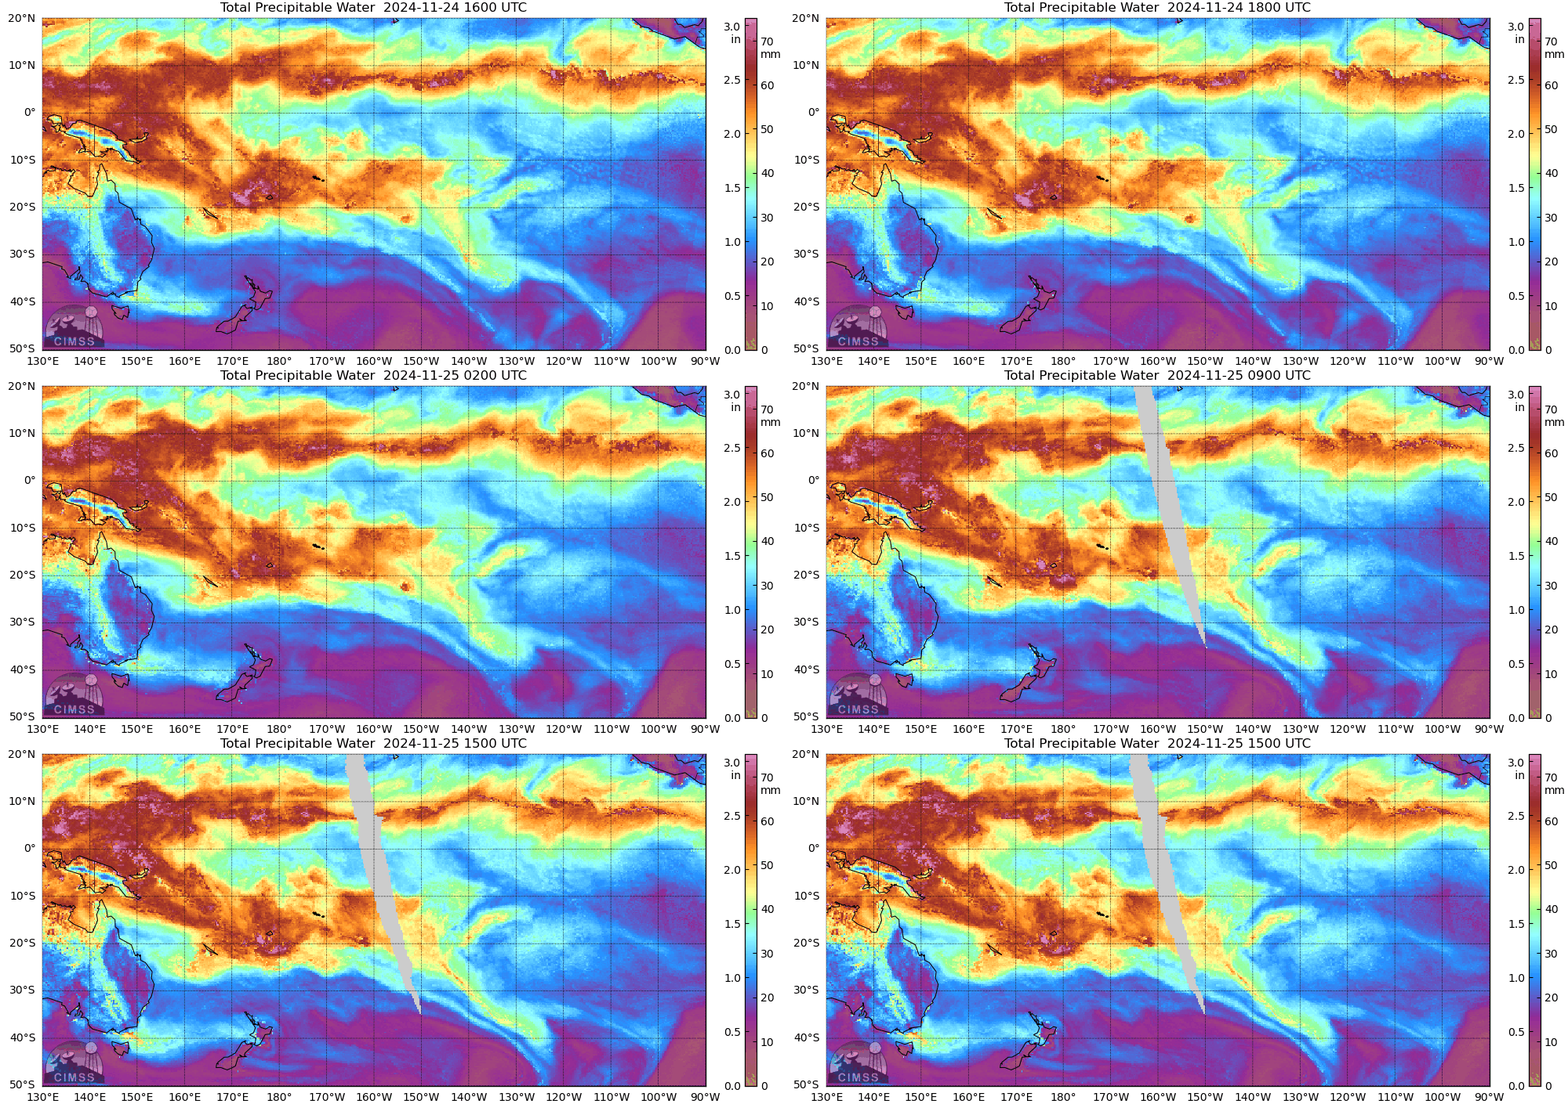
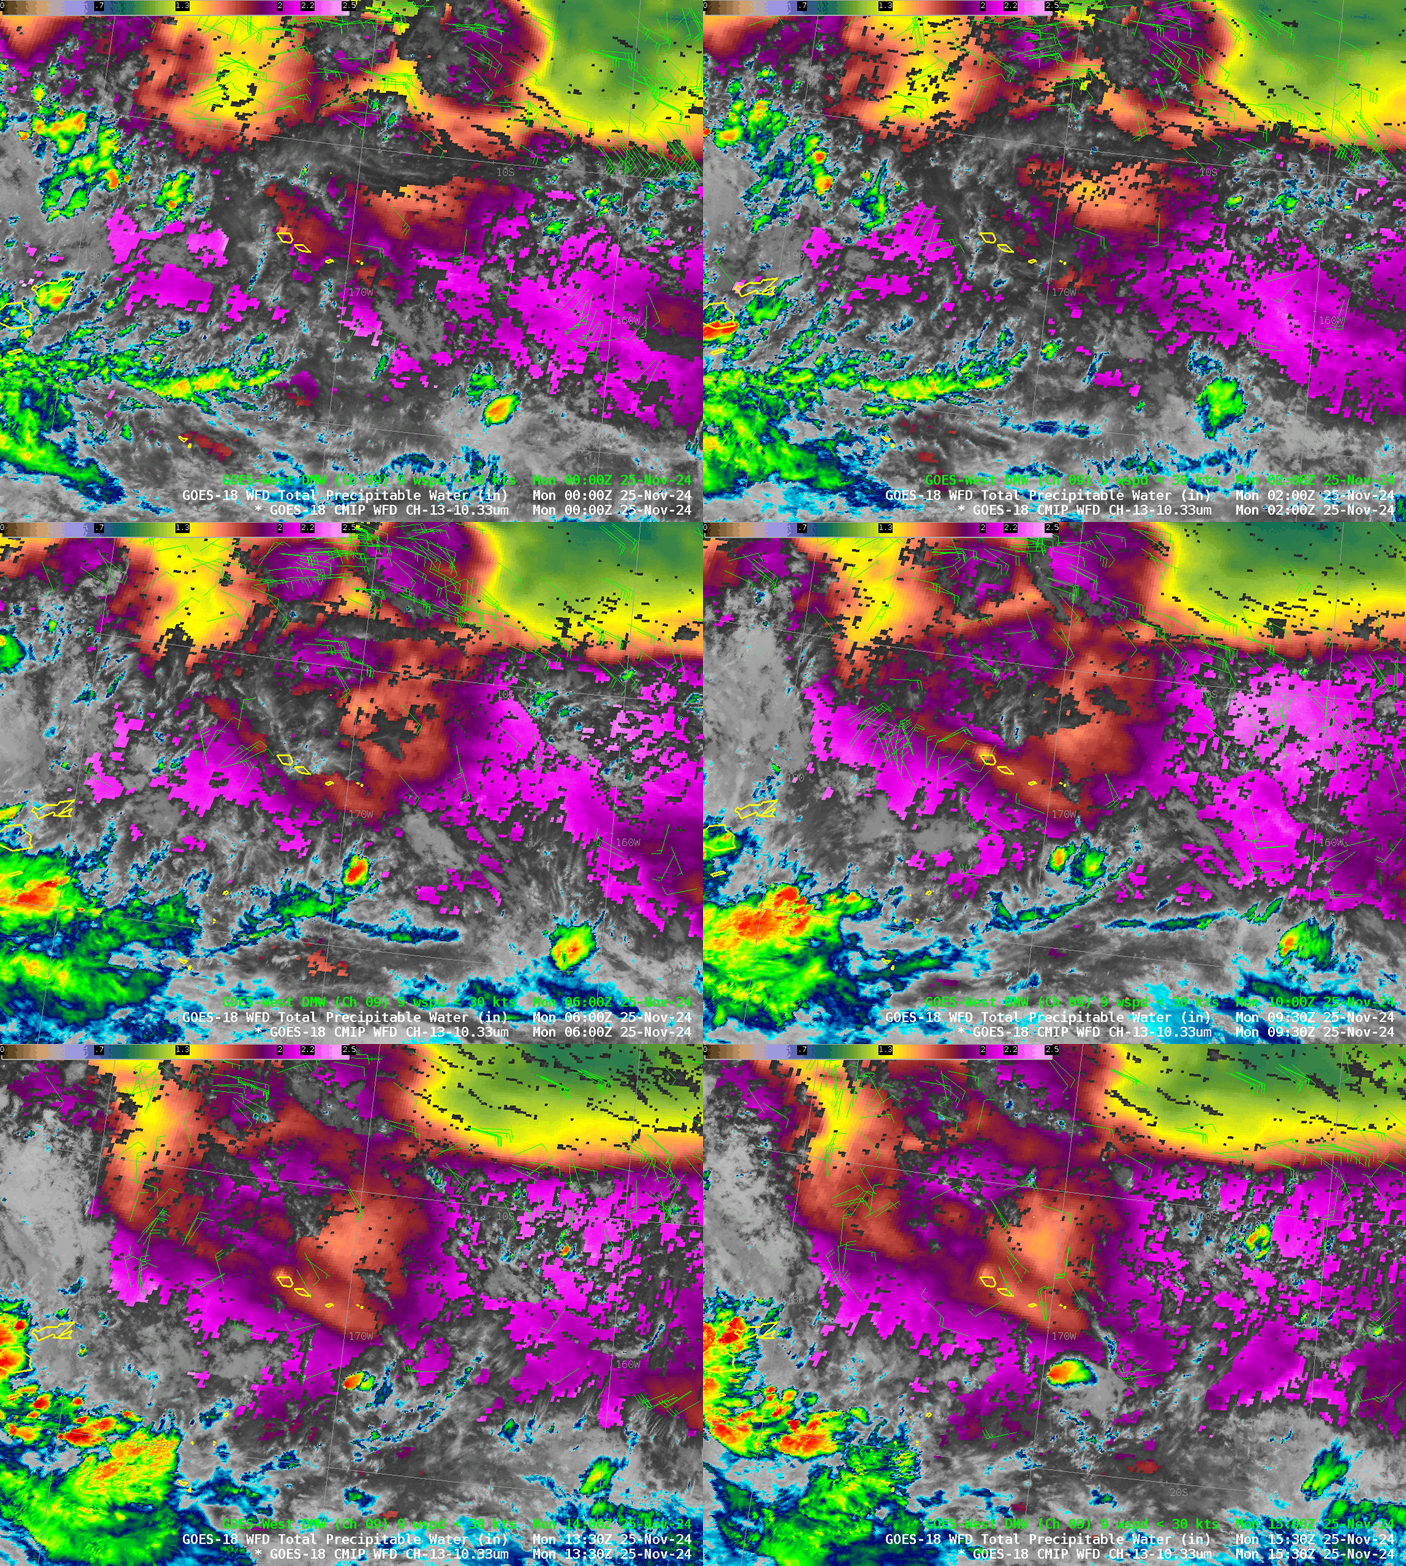
GOES-West imagery centered over the Samoan Islands, shown above in an animation, shows a region of rich moisture surrounding those islands (purple in the enhancement, which suggests values or 2-2.2″), but the islands themselves are within a dry pocket (TPW values closer to 1.7″, orange/rust in the enhancement used). Total Precipitable Water derived from Microwave data, below (from the MIMIC website), shows similar values, including the local minimum over Samoa. A benefit with microwave observations of atmospheric moisture (compared to ABI) is the ability to detect values in the presence of clouds.
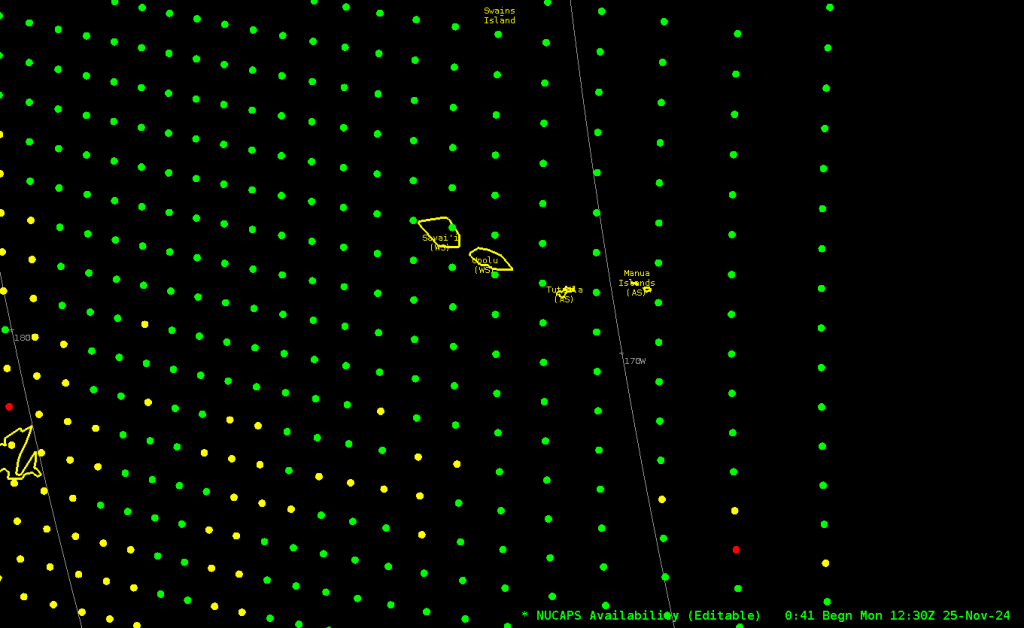
Pago Pago airport does have an upper-air station. However, hydrogen generation difficulties at that site in the past months have meant that balloon launches are limited, and one did not occur at 1200 UTC on 25 November. However, NOAA-20 overflew the region shortly thereafter and NUCAPS soundings can estimate the thermodynamic profile. The plot below shows where profiles are available; green points signify profiles for which the infrared retrieval converged to a solution, typically in regions of mostly clear skies (as might be inferred from the GOES-18 imagery above!)
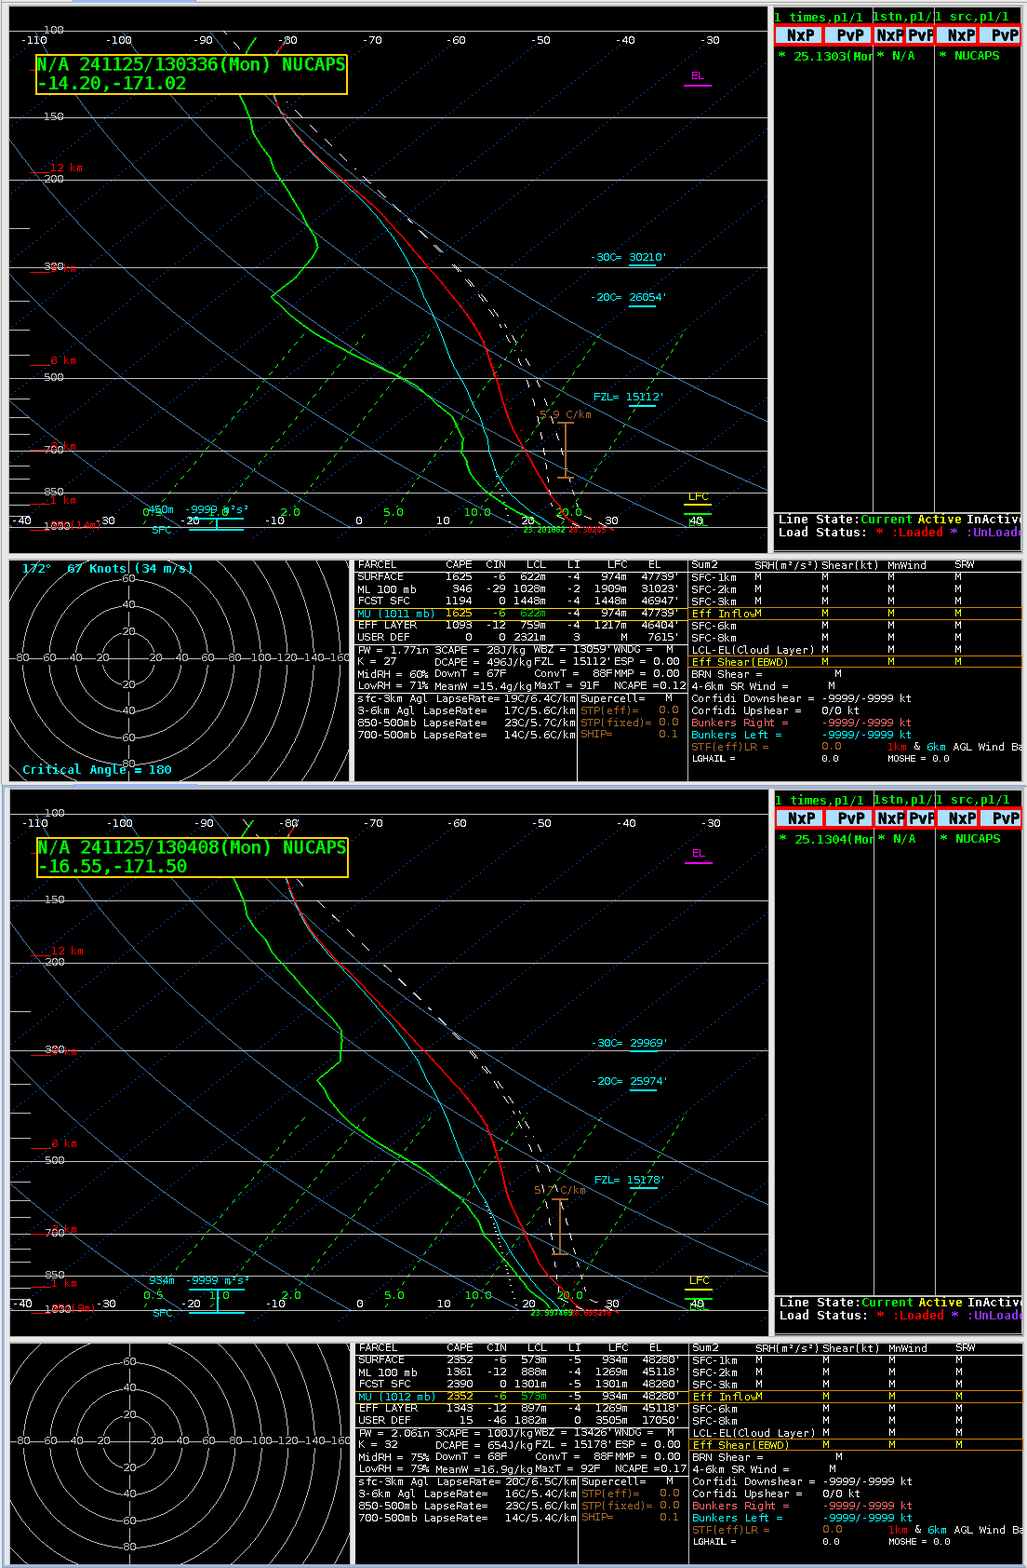
The toggle below shows two NUCAPS profiles, one just west of Tutuila (at 14.2oS, 171.5oW) and one 6 points to the south (at 16.55oS, 171.5oW). Note the larger values of TPW in the more southerly sounding, consistent with what is discussed above. Otherwise, the profiles are quite similar.
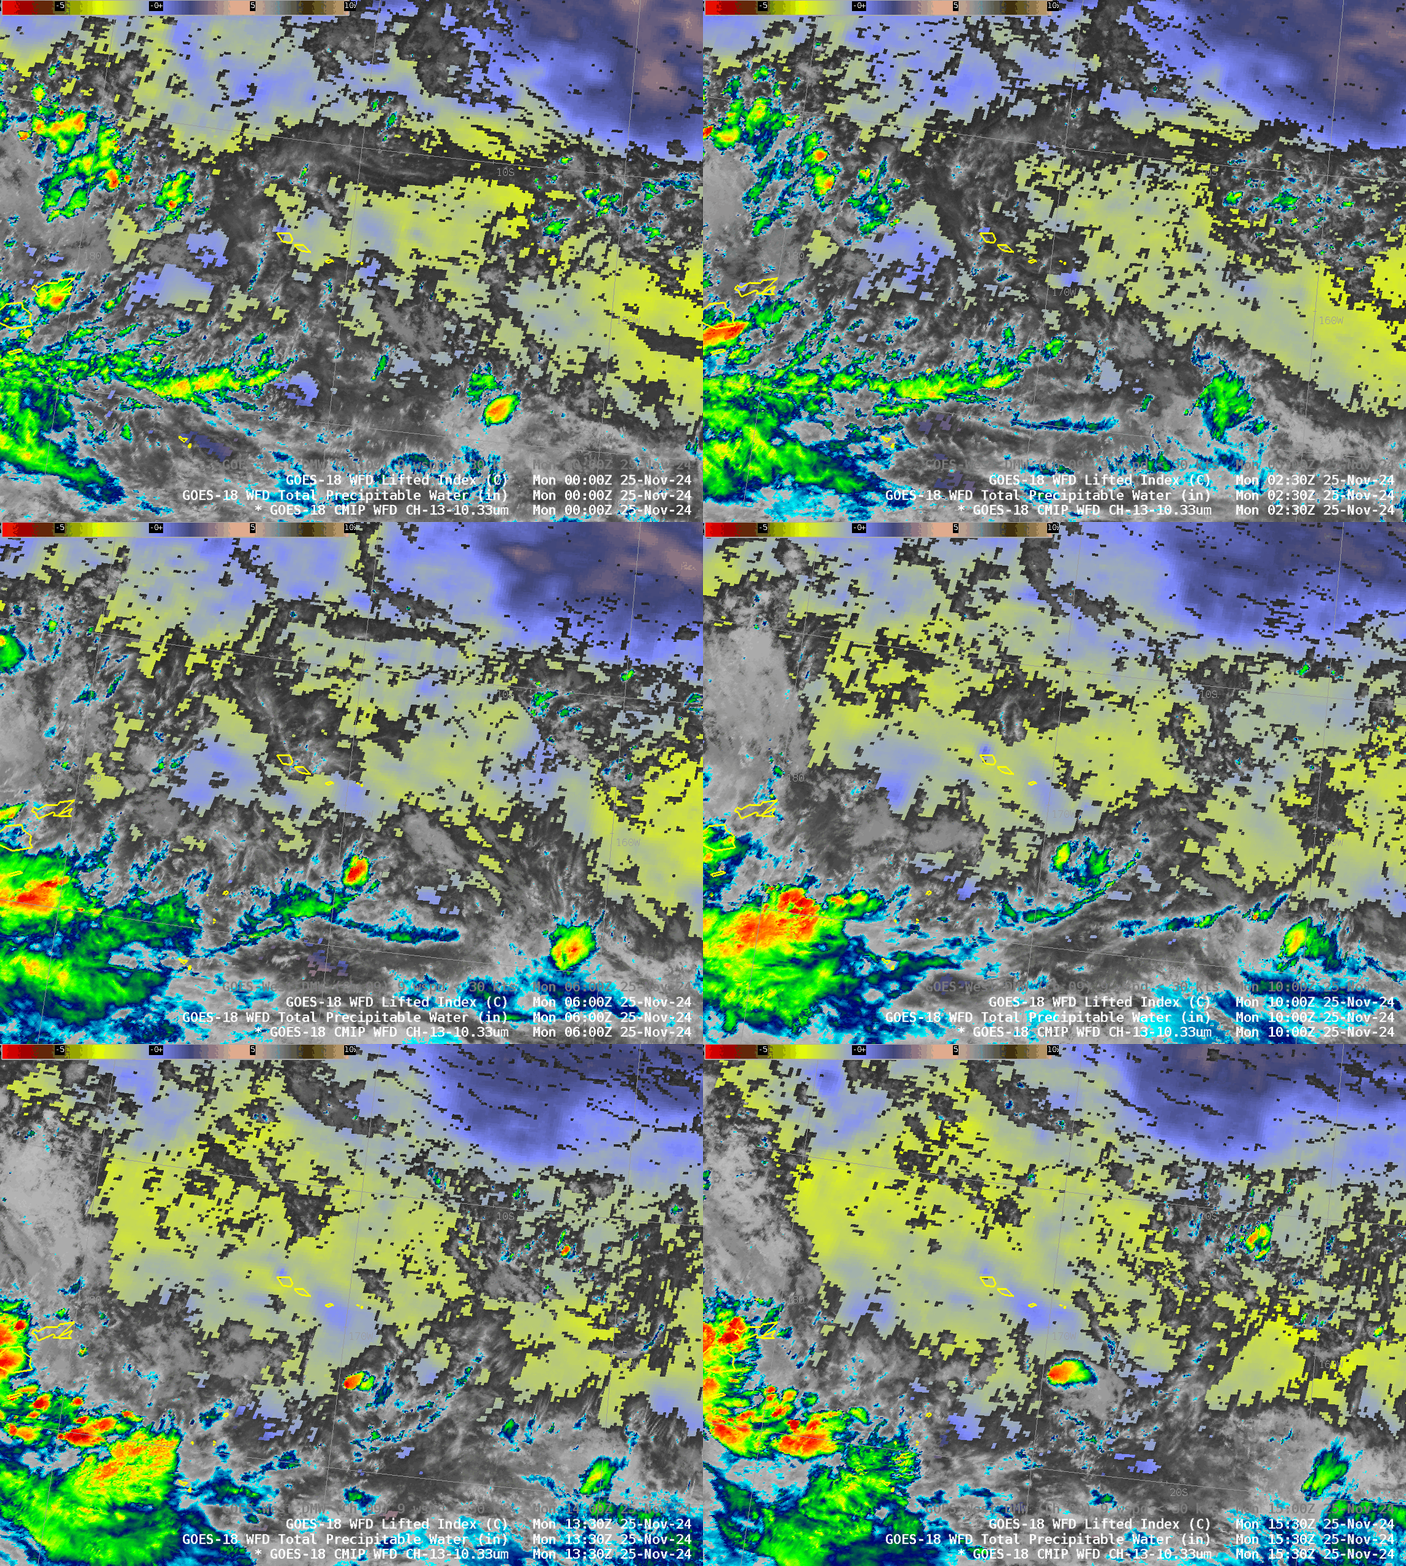
Level 2 products also include clear-sky measures of instability, such as Lifted Index and Convective Available Potential Energy (CAPE). The Lifted Index field below shows pockets of stability (blue in the enhancement used) surrounded by minor instability (yellow in the enhancement) surrounding the Samoan Islands.
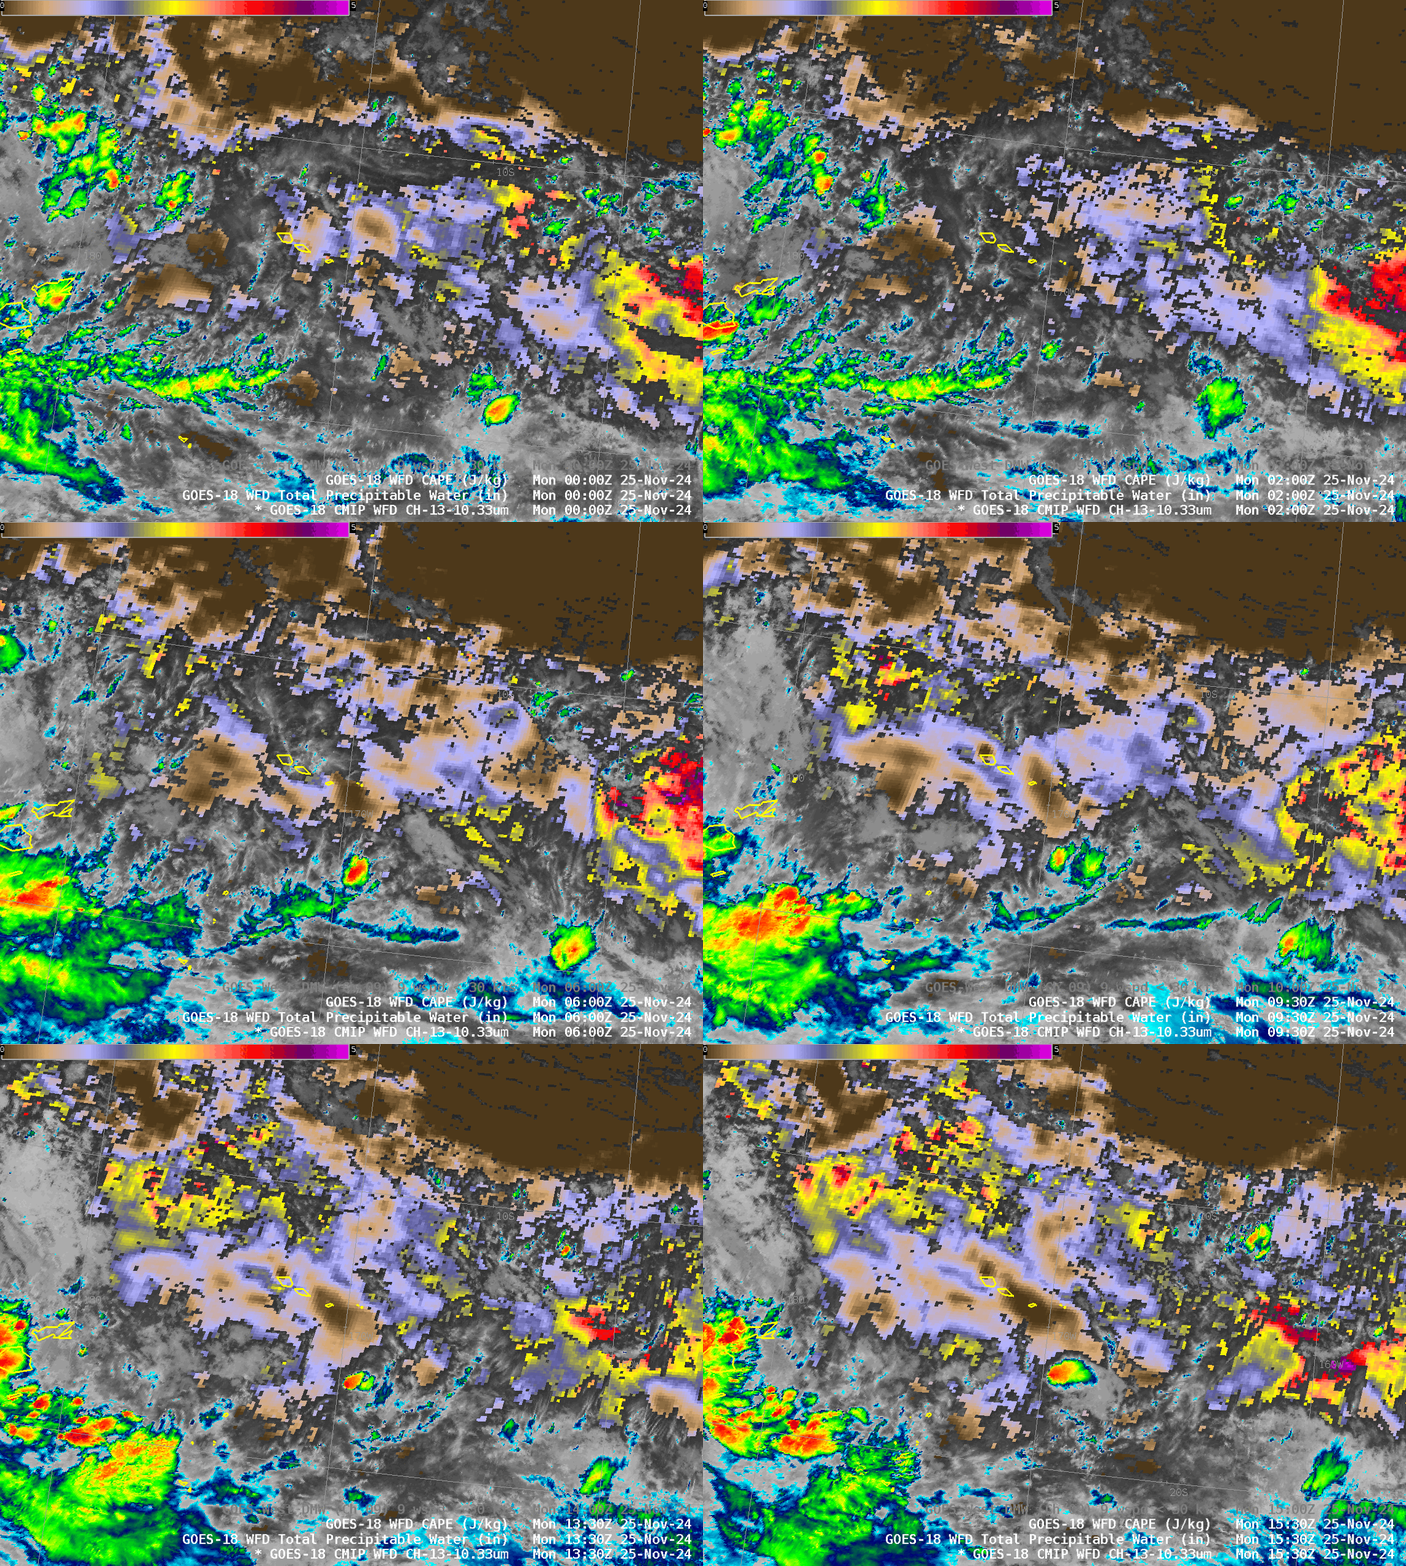
CAPE values (scaled from 0-400 J/kg) similarly show relatively weak regions of stability and instability surrounding the Samoan islands.
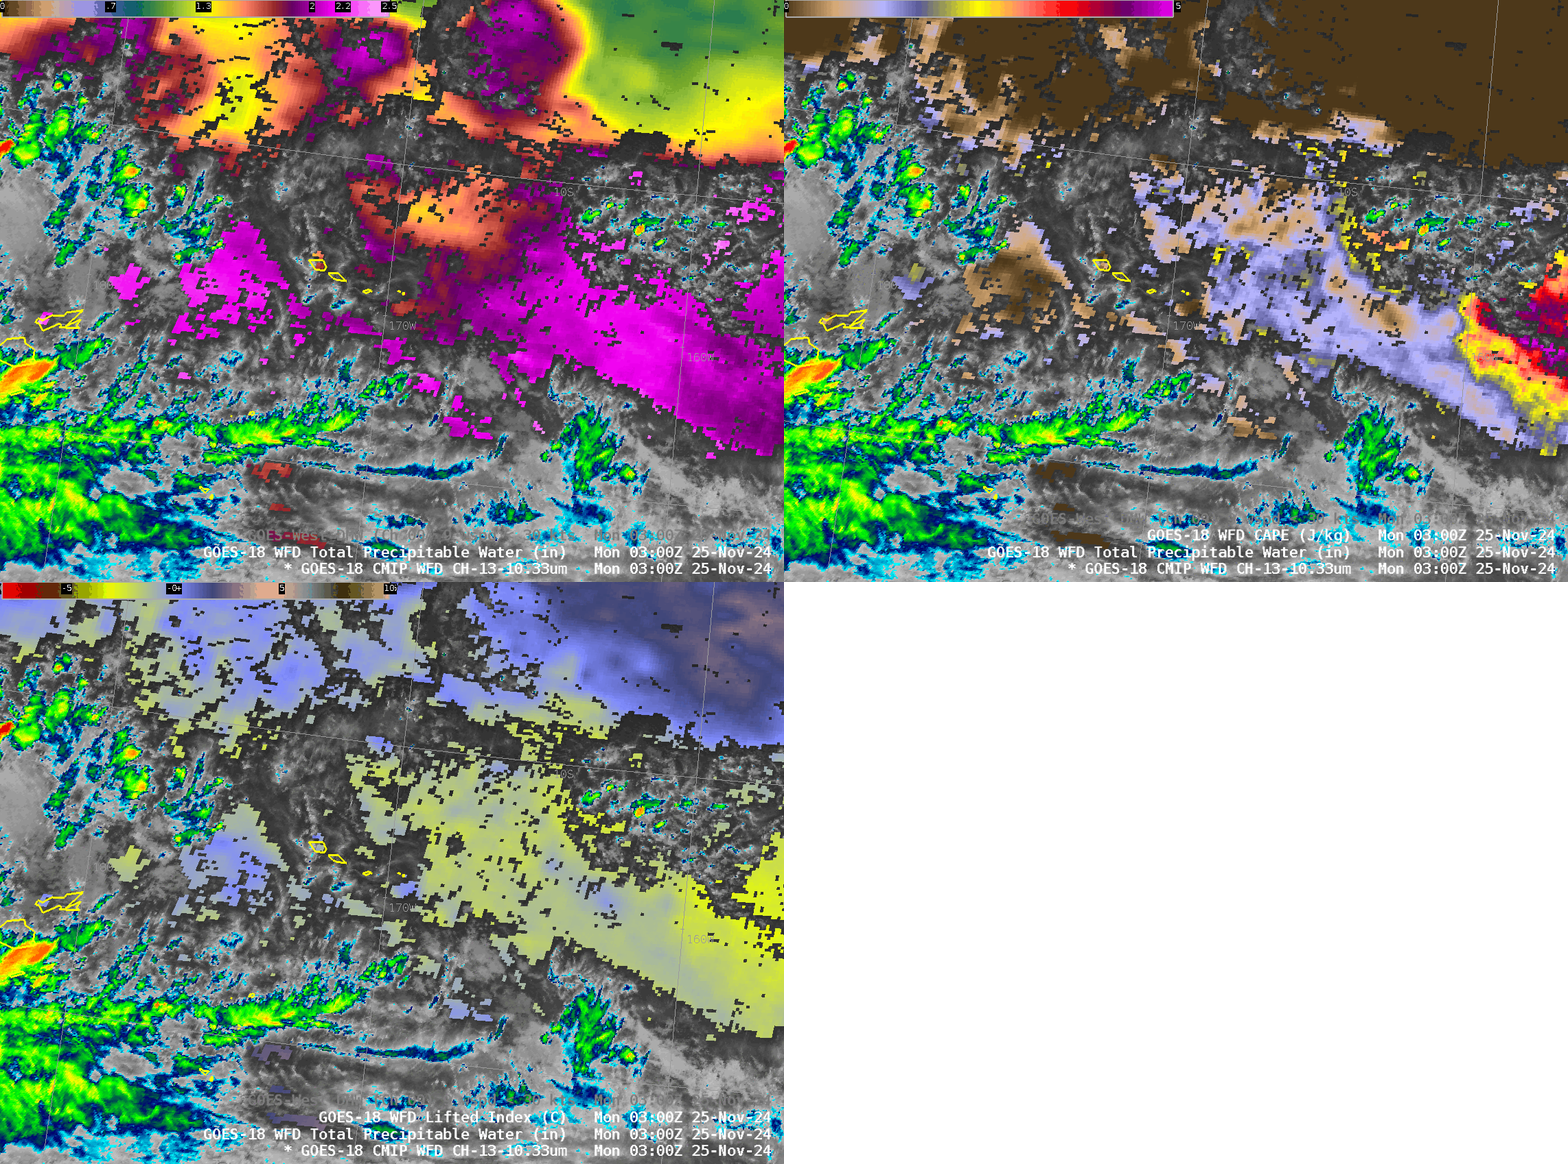
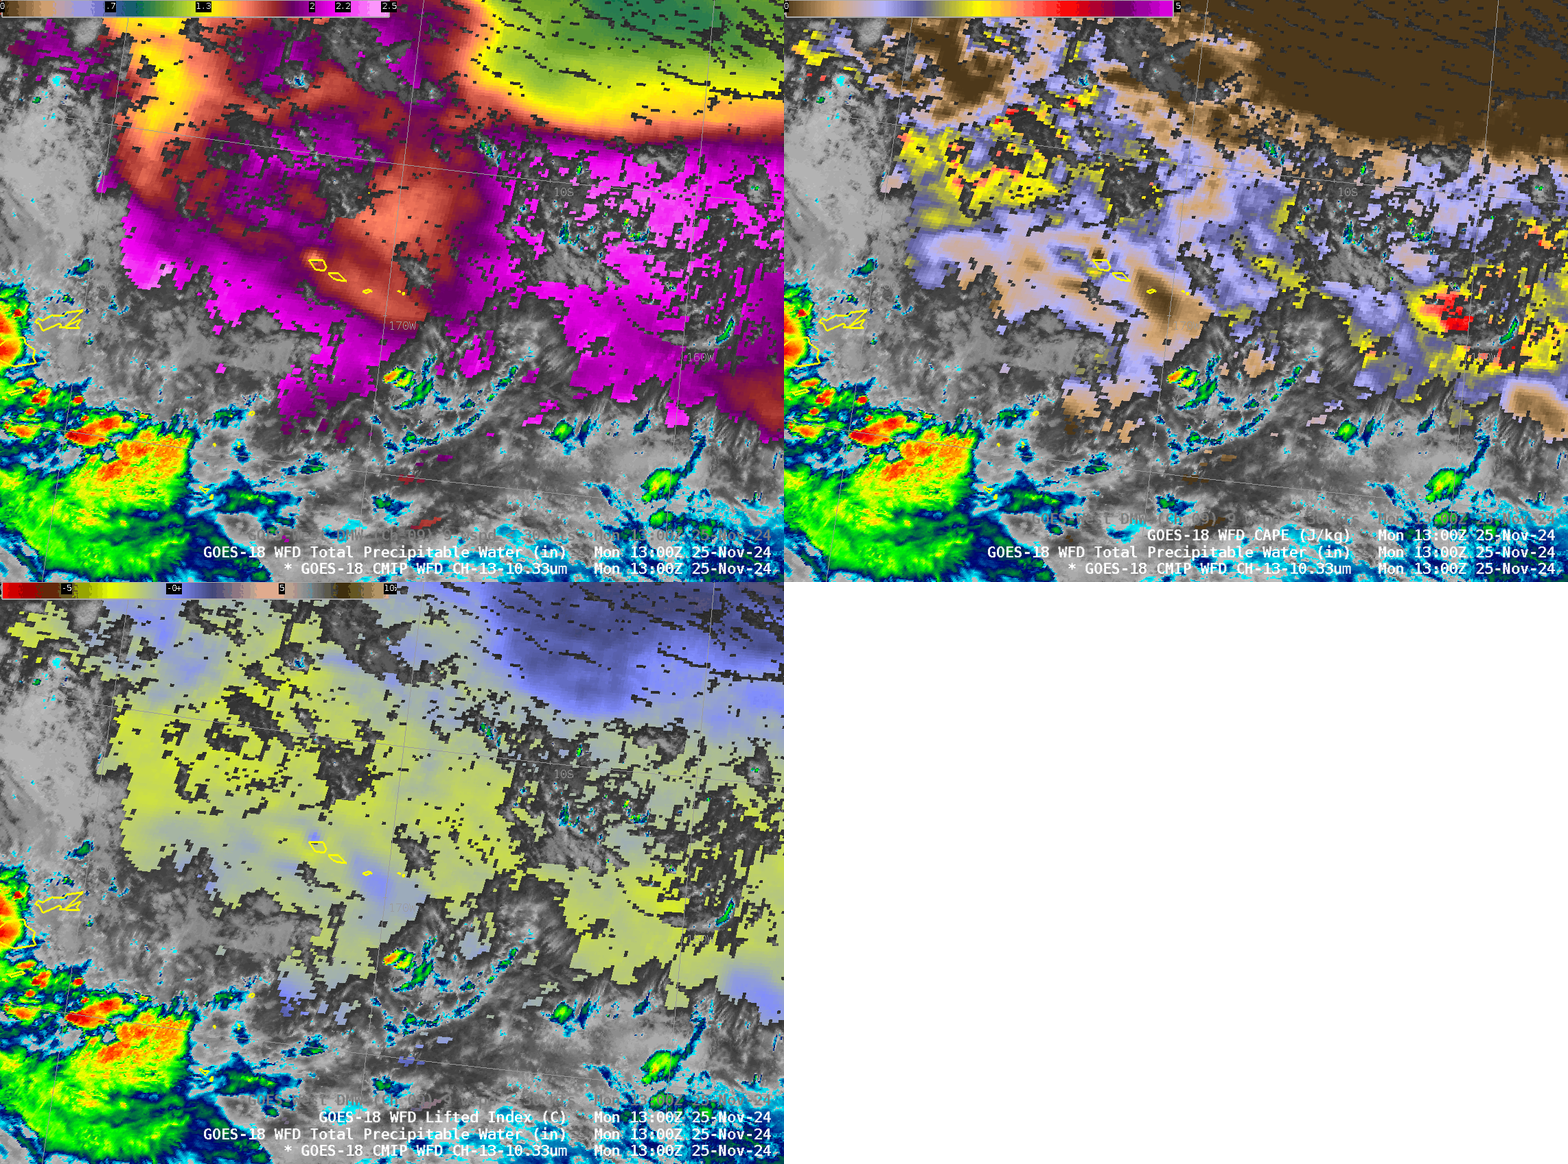
The TPW fields, and the Derived Stability Indices, do have similarities as might be expected. The toggles below compare TPW, LI an CAPE at 0300 and at 1300. Interestingly, the strong values of CAPE at the eastern edge of the domain at 0300 UTC seemingly have no echo in the other fields. In other regions (north of the Samoan Islands, for example), minima in CAPE and relative stability in Lifted Index occur where local minima in TPW exist. This case demonstrates how one stability index might not give the same information as another; make sure you have access to both!
The (anti-clockwise) motion of the cloud features above suggests that an anticylone is present over the islands The animation below includes GOES-West derived motion wind vectors computed from Band 9 (mid-level water vapor, 6.95 µm) infrared images. The wind vectors are from near 350 mb, which height is determined by matching the Band 9 brightness temperature to GFS model temperatures.
Level 2 Products, especially in regions — like the South Pacific Ocean — where conventional data are lacking, can give a forecaster needed insight into how the atmosphere might evolve with time.
—————
Free Secure Email – Transcom Sigma
Transcom Hosting
Transcom Premium Domains
