
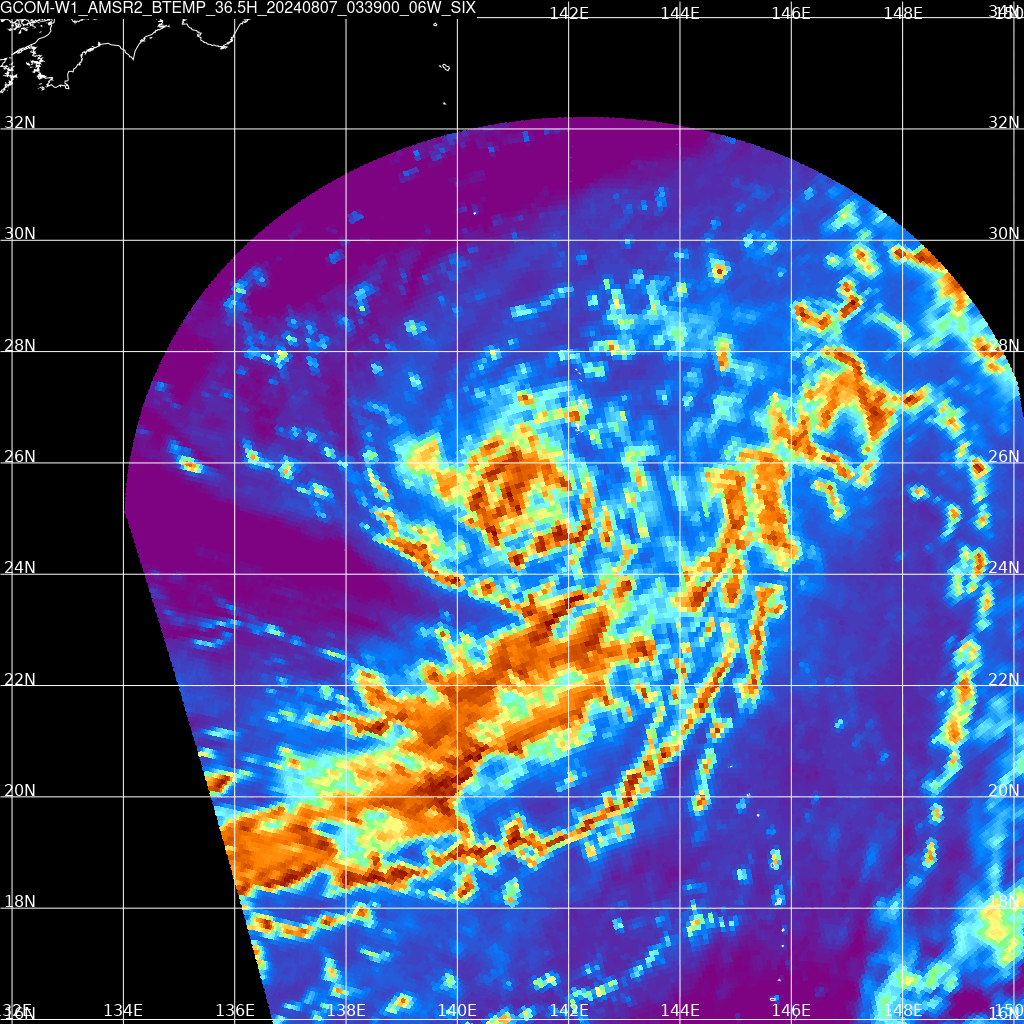
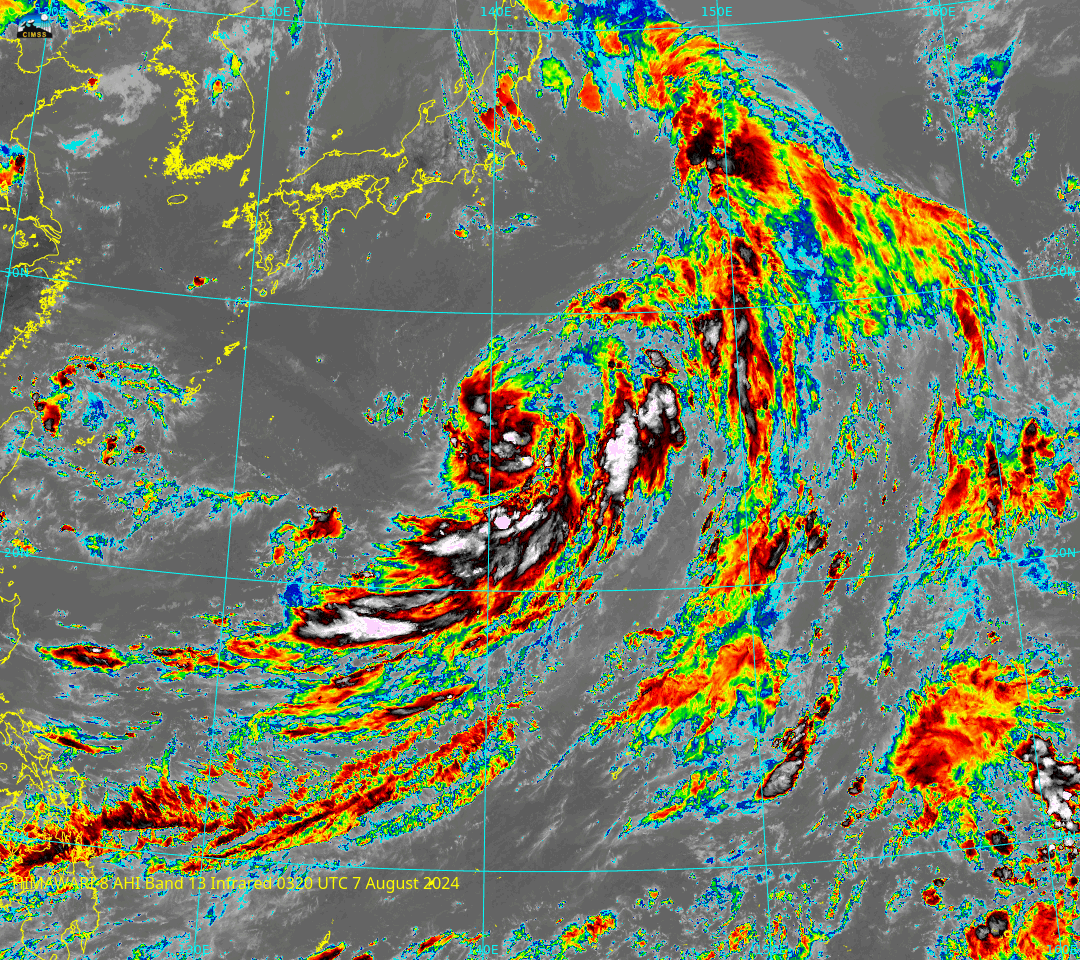
Direct Broadcast imagery of a tropical system north of Guam
The National Weather Service forecast office on Guam has a Direct Broadcast antenna, and CSPP software takes the downloaded signal and creates useful imagery. The example below shows JAXA’s GCOM AMSR-2 imagery at 36.5 and 89.0 GHz, and the structure of the low-level circulation (36.5 GHz) and upper-level clouds (89.0 GHz) are apparent. In the 36.5 GHz imagery, it’s likely the orange/red features are rain-producing clouds The 89.0 GHz imagery is coldest (yellow and red in that enhancement) where ice features are present because ice scatters 89.0 GHz energy very effectively. (The Joint Typhoon Warning Center has information on this storm here).
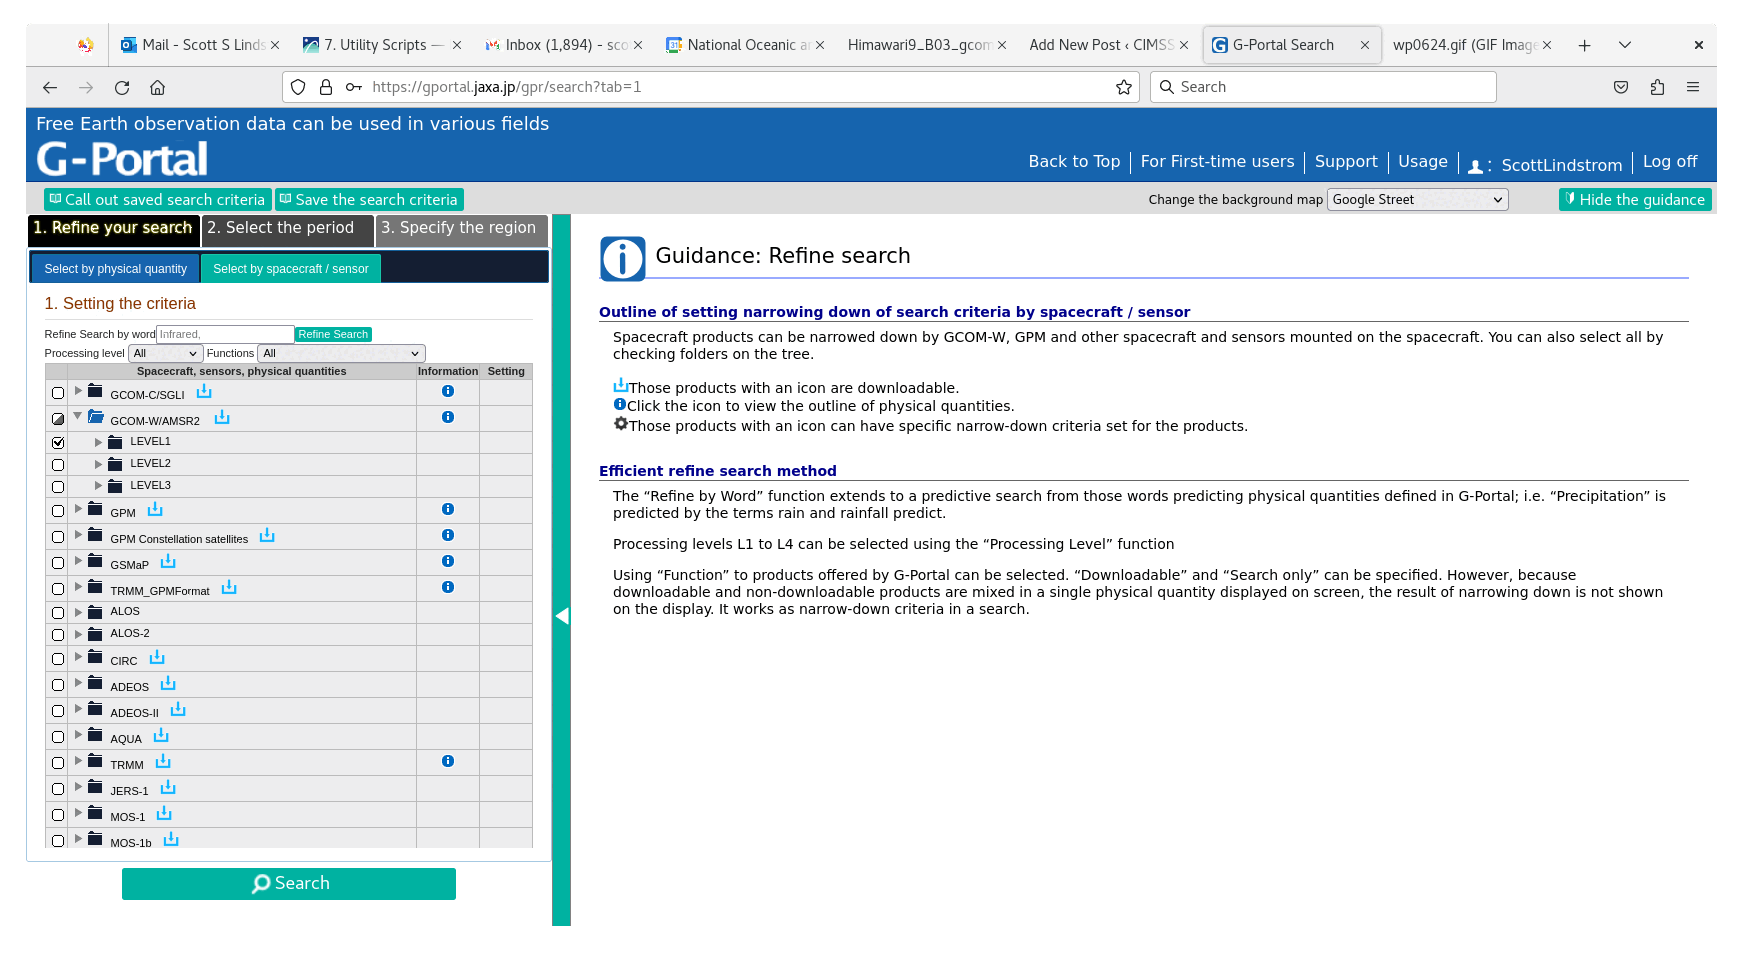
Thanks to Douglas Schumacher, CIMSS, for forwarding along this imagery. But what if you don’t have the helpful Douglas to send you imagery? In that case, you can use Polar2Grid to create imagery from files downloaded from JAXA’s GPortal! That website allows a registered users (free registration!) to select specified data from a specific day over a specified region as shown in the succession of screen captures below.
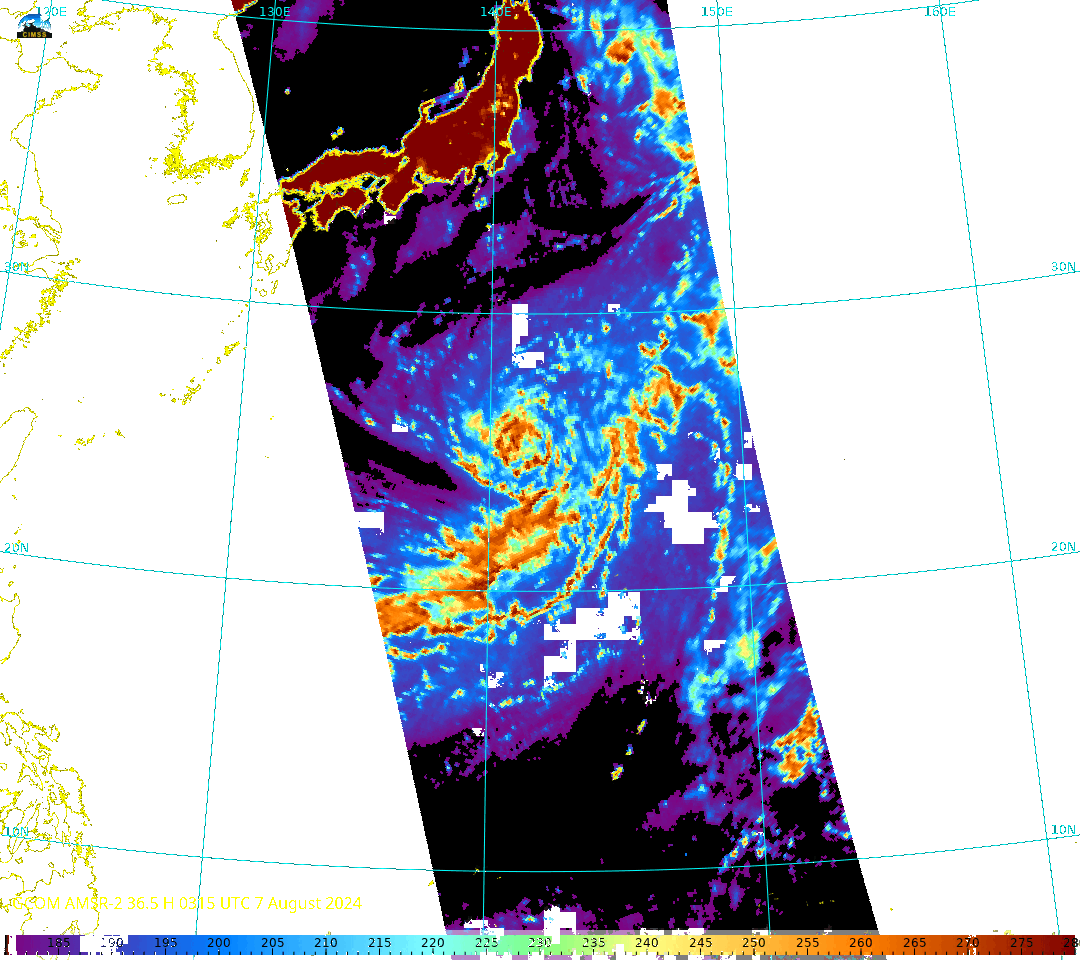
The downloaded data can be processed with Polar2Grid software (using the -r amsr2_lib flag that reads AMSR-2 Level 1b data). This software can then produce imagery as shown below — looking very similar to the data from the Direct Broadcast antenna, but covering a larger area.
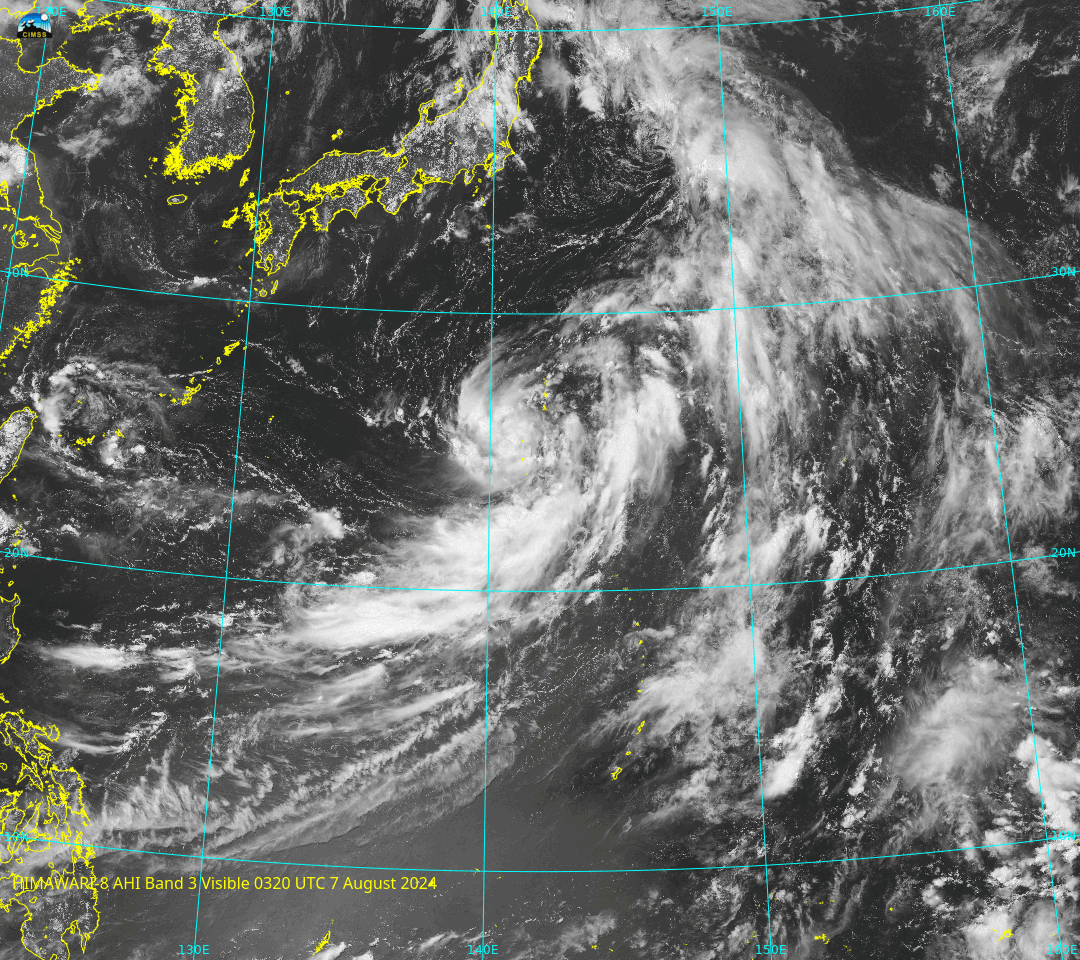
A user can then get Himawari data (from, for example, an Amazon bit bucket) and use Geo2grid software to create imagery, shown below, with the same map projection as used for the Polar2grid imagery!

Combinations of Visible and Enhanced infrared imagery with the color-enhanced Microwave data are shown below. The combination of polar and geostationary satellite data yields a more complete understanding of the system.
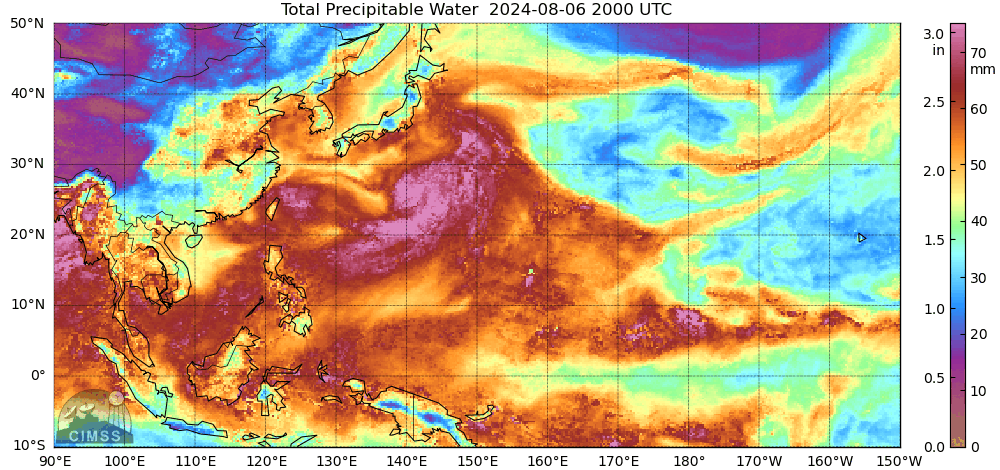
MIMIC Total Precipitable Water fields, below, show abundant moisture in the West Pacific including over Marianas Islands and Micronesia. A picture of rain on Guam from the WCM (Thanks Landon!) led me to investigate this system.
—————
Free Secure Email – Transcom Sigma
Transcom Hosting
Transcom Premium Domains