
Debby in the northeast Gulf of Mexico and a very moist airmass
MIMIC Total Precipitable Water fields, above (source), for the 24 hours ending at 1700 UTC 4 August 2024, show the cyclonic spin (and ample moisture) associated with Tropical Storm Debby as the system moves northward from Cuba into the eastern Gulf of Mexico. (A tropical disturbance is also present south of Mexico in the tropical Eastern Pacific.) Abundant moisture is also present off the southeast coast of the USA, and as Debby moves north (landfall as a hurricane is predicted Monday morning in Florida’s Big Bend region; for the latest on Debby, consult the website of the National Hurricane Center), the storm’s circulation will draw that moisture inland. Very heavy rain is anticipated from Florida northeast into the Carolinas.
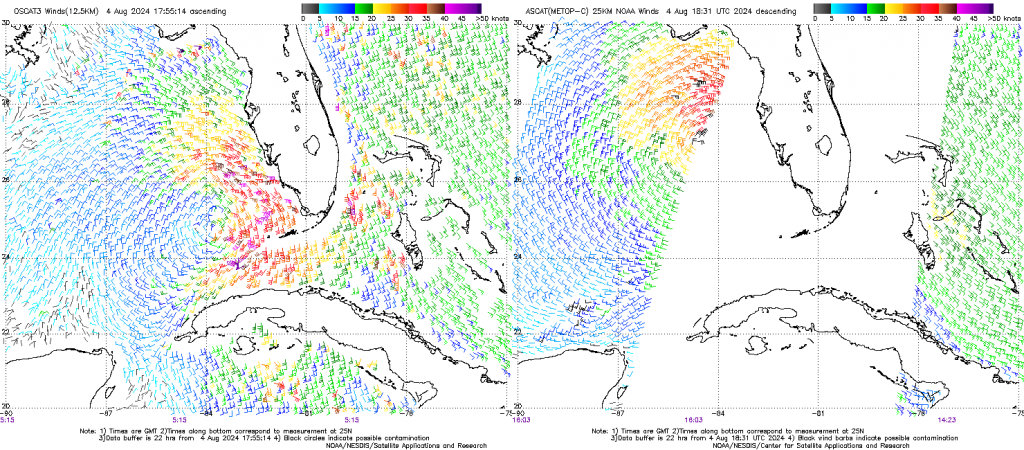
Scatterometry from OSCAT-3 on India’s OceanSat-3 and from ASCAT on EUMETSAT’s Metop-C, below, (available here) captured the changes in the circulation between 0515 UTC and 1607 UTC on 4 August 2024. At 0515 UTC, the strongest winds were on Debby’s eastern flank. Unfortunately, Metop-C (and Metop-B, not shown) did not sample that part of the storm during the day on 4 August.
The animation below shows half-hourly imagery from 0406 – 1836 UTC on 4 August, bracketing the times of the Scatterometry overpasses above. Debby shows an increase in organization by the end of the animation, with the development of a central core of convection (albeit small!). Dry mid-level air is suggested to the west of the storm by the yellow enhancement in the water vapor imagery and the general lack of convection over the central Gulf of Mexico, but the dry air does not appear to be affecting the evolution of the system.
A GOES-16 mesosector (#2) has been positioned over the storm. One-minute imagery, below, for the hour ending 1850 UTC on 4 August 2024 (combined with GLM observations of Flash Extent Density) show the slow increase in organization of the storm.
For the latest information on Debby, refer to the webpages of the National Hurricane Center. The SSEC/CIMSS Tropical Weather website also contains storms information. You can find more information as well at the websites of National Weather Service offices in Tallahassee, Jacksonville, Charleston (SC), Columbia, Atlanta and Wilmington (NC) . NOAA’s Weather Prediction Center is issuing excessive rainfall graphics for the storm as well, with 16-20 inches of rain predicted from Savannah GA to northeast of Charleston SC.
—————
Free Secure Email – Transcom Sigma
Transcom Hosting
Transcom Premium Domains