Comparing PHS 4-km WRF model output and 3-km HRRR output on a High Risk Day
The Storm Prediction Center has deemed 6 May 2024 as a day with a High Risk of severe weather over the central/south-central Plains:
...SUMMARY...
   A regional outbreak of severe weather with multiple intense (EF3+),
   long-tracked tornadoes, as well as very large hail and severe
   thunderstorm gusts, is expected over parts of the south-central
   Plains from this afternoon through evening.
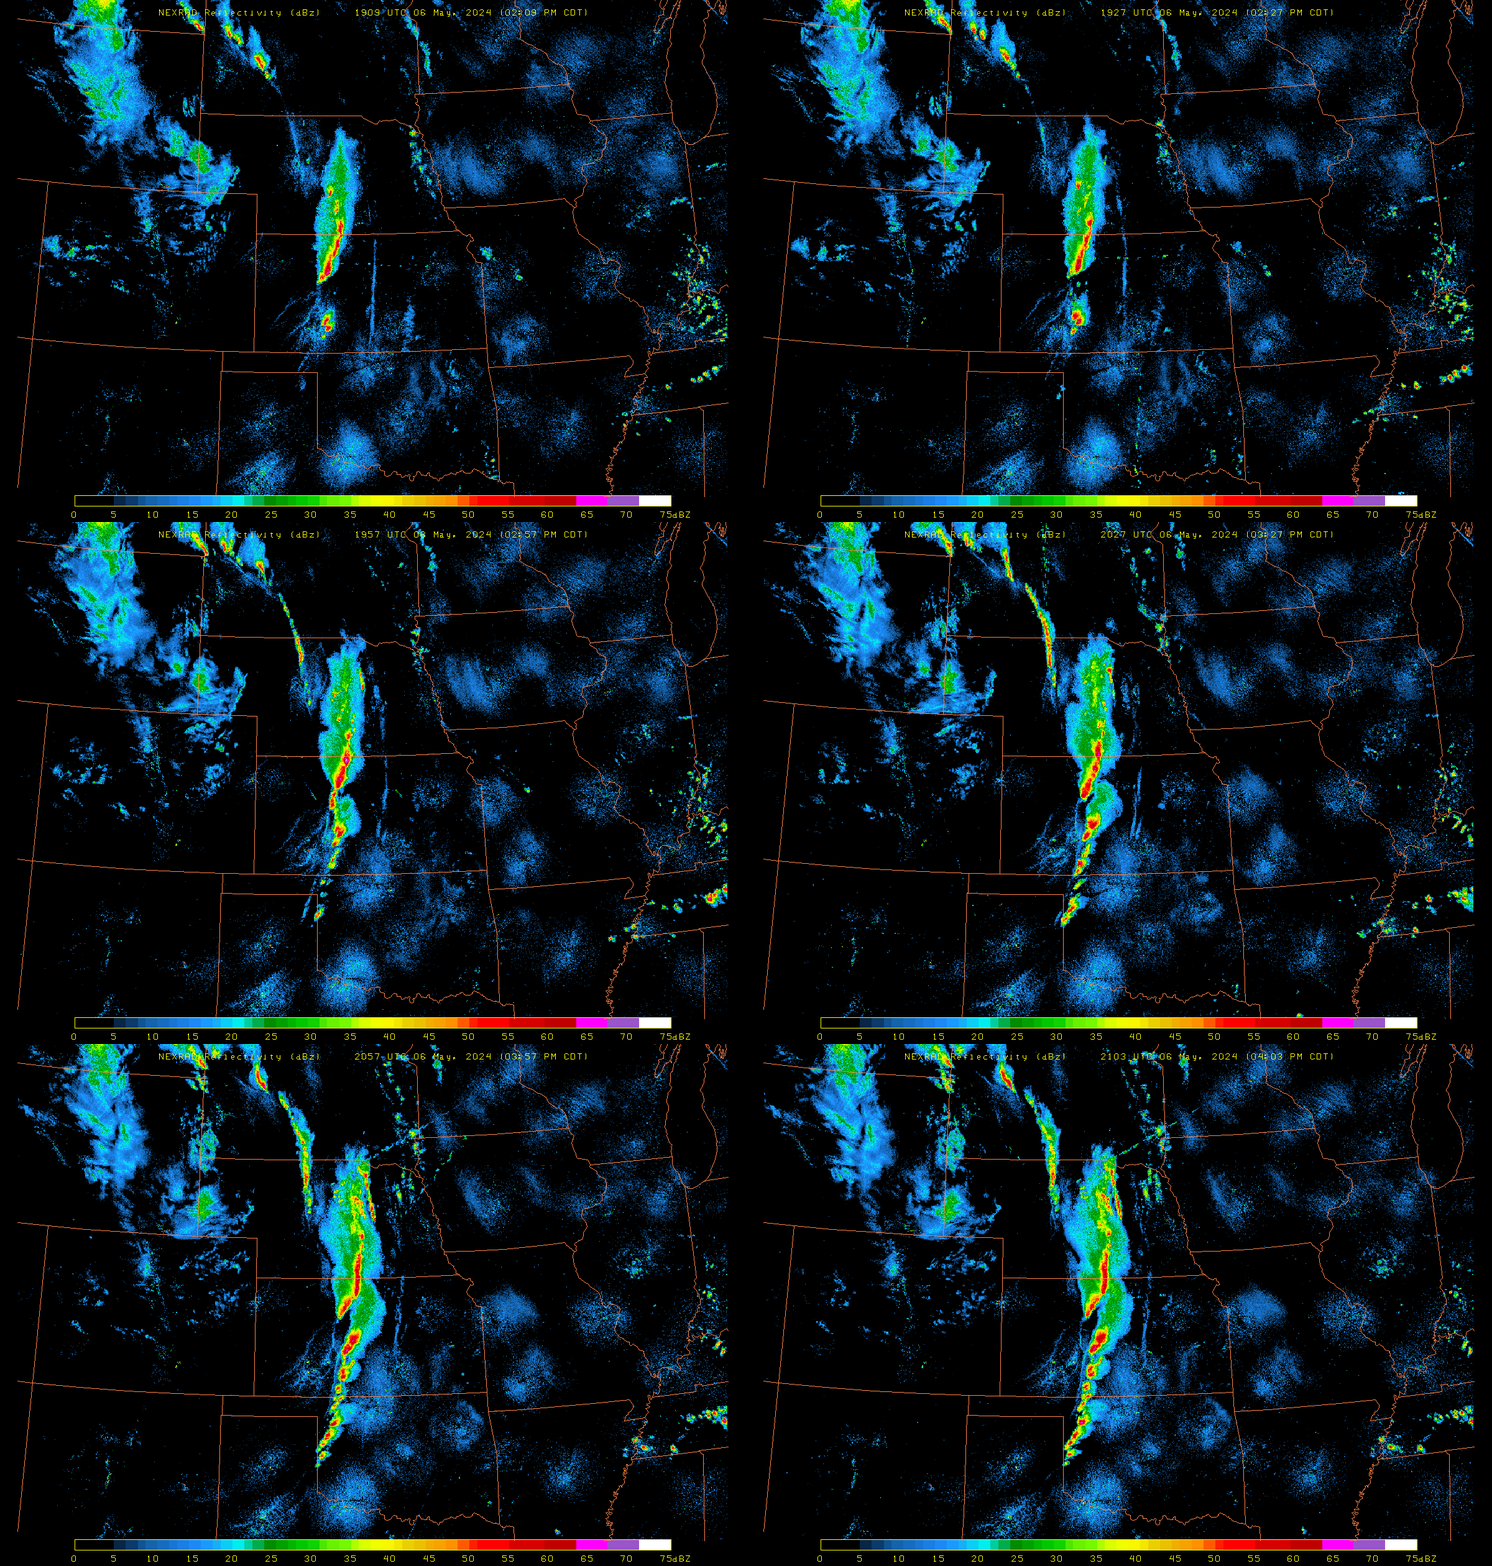
By 2100 UTC, strong convection had developed from South Dakota southward to western Oklahoma, as shown in the radar animation below (source).
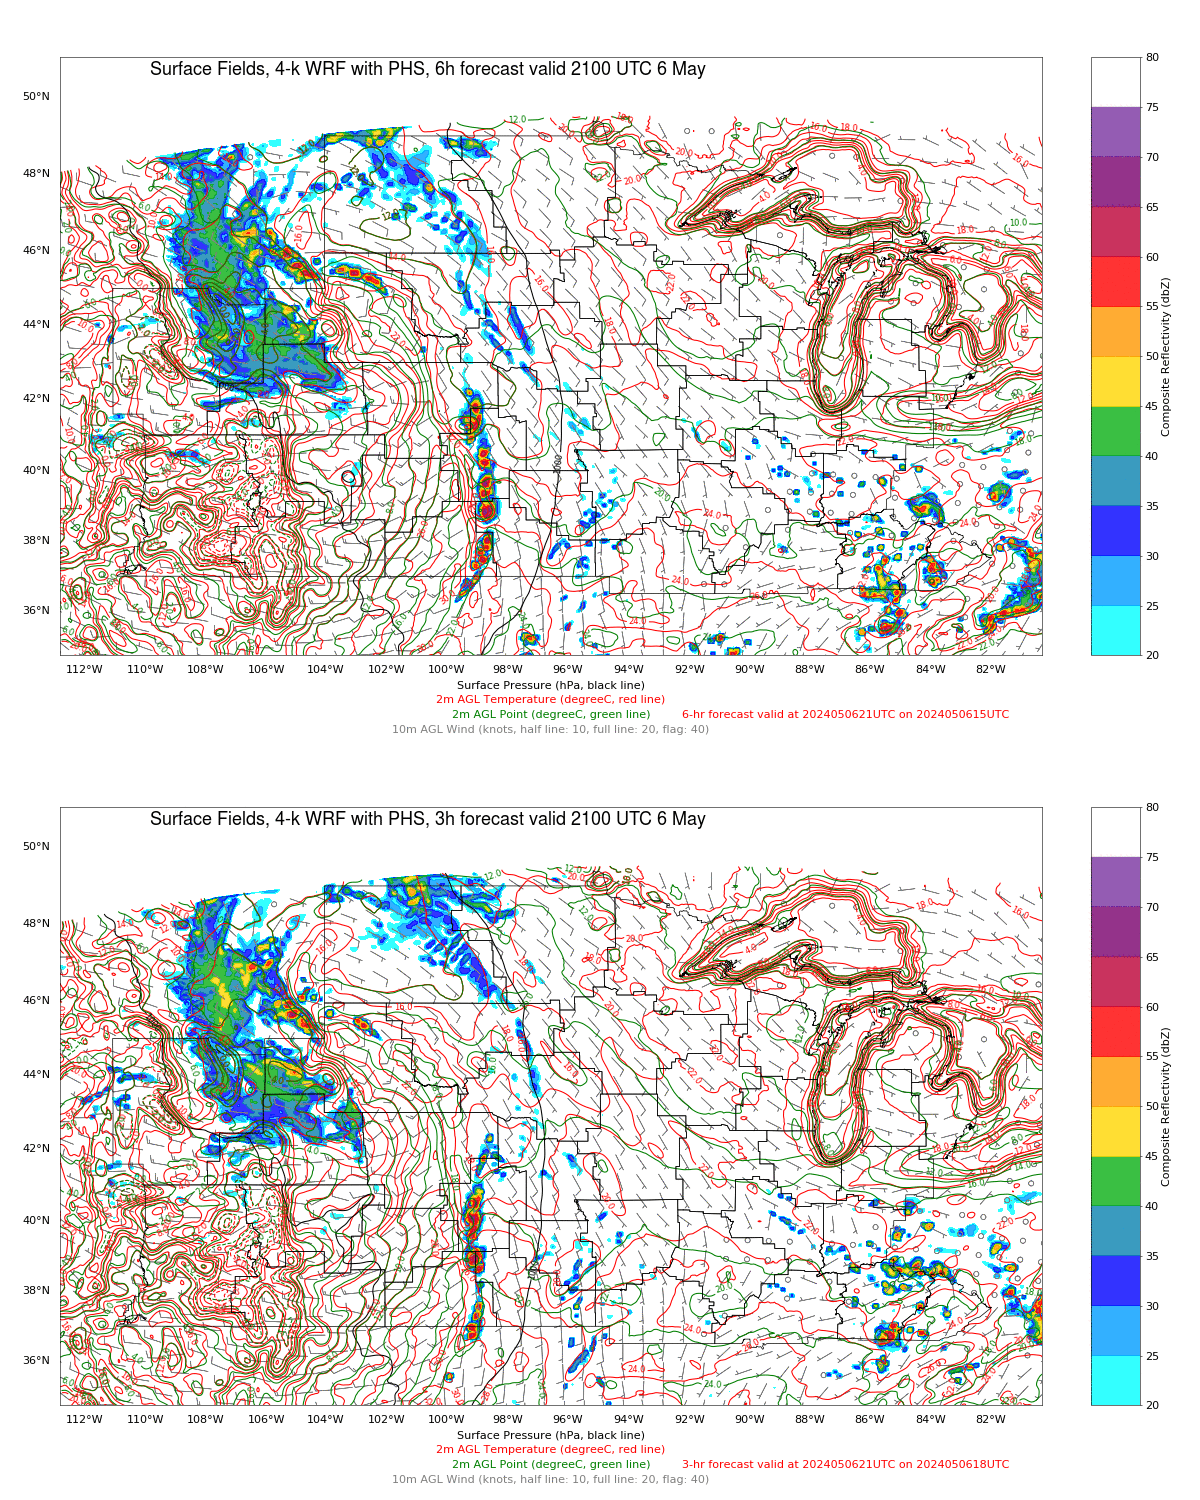
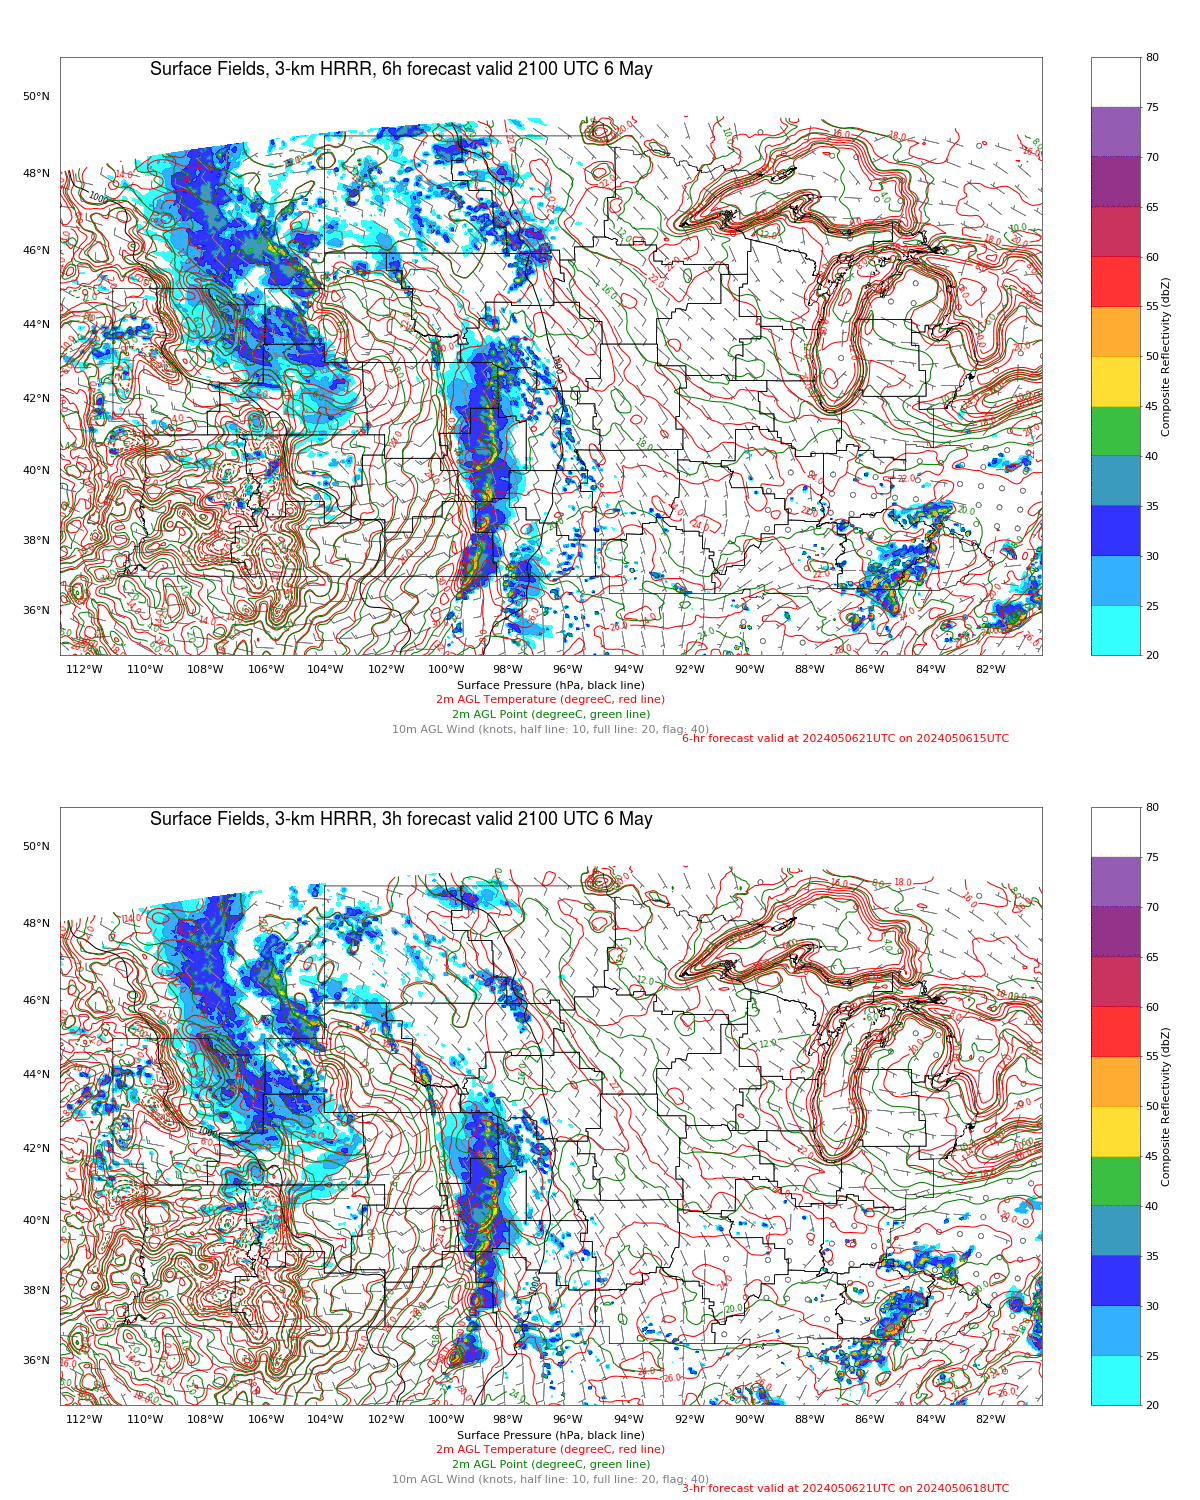
The Polar Hyperspectral Model (PHS) includes as its assimilated input Fusion Data, i.e., ABI “retrievals” that are matched to the latest observations from Low Earth Orbit (LEO) Hyperspectral Soundings. The ABI retrievals thus have the great spatio-temporal resolution of ABI data and the excellent spectral resolution of the LEO Sounders. The result is a better description of the initial moisture distribution in the model. How is this performing today? Imagery below was taken from the model website here; once there click on Forecast Plots and then on the calendar to the correct day. The toggle below compares the 6-h forecast and the 3-h forecast of the PHS-influenced model (a 4-km WRF simulation). A series of Supercellular-like storms arcs from Nebraska southward to Kansas, with strong storms in northwestern South Dakota as well. Compare the toggle below to the one from a 3-km HRRR simulation that has not been influenced by PHS data. The HRRR simulation shows weaker convection.
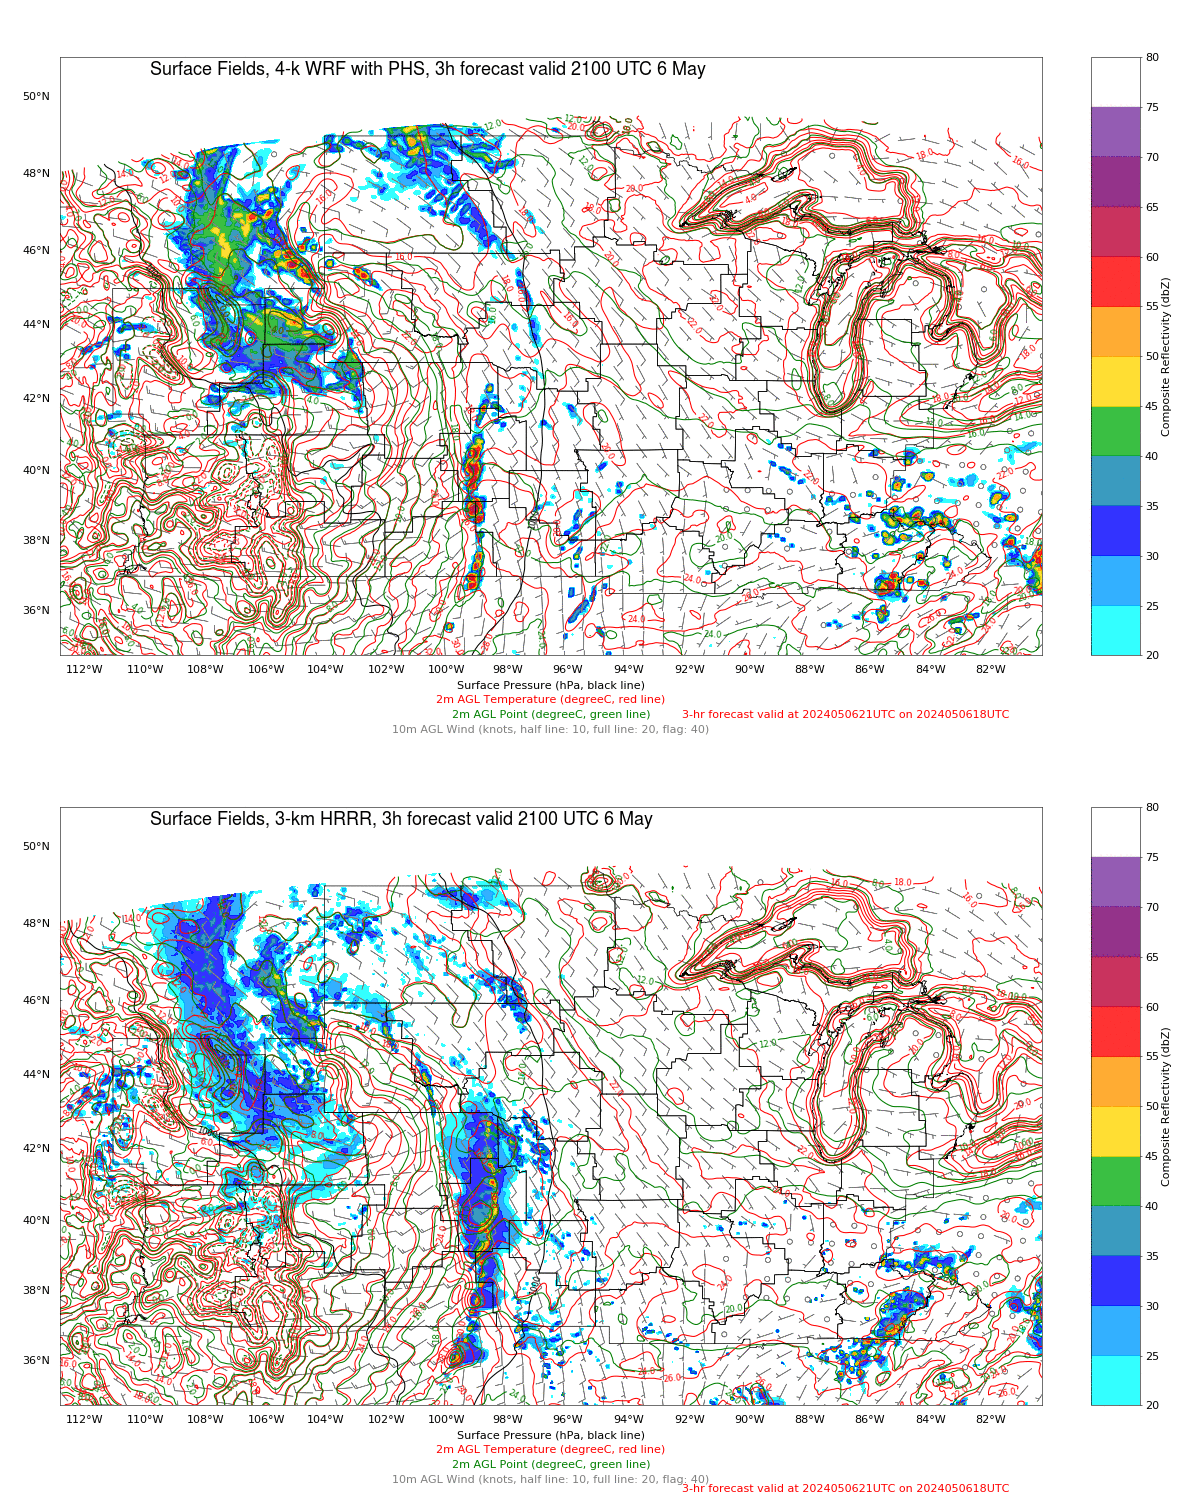
The toggle below compares the 3-h forecasts (valid at 2100 UTC) of 3-km HRRR (no PHS data) with the 4-km WRF (with PHS data). (Here is a similar comparison of 6-h forecasts valid at 2100 UTC) The PHS data has lead to a more accurate simulation of the convective strength over Nebraska, Kansas and South Dakota.
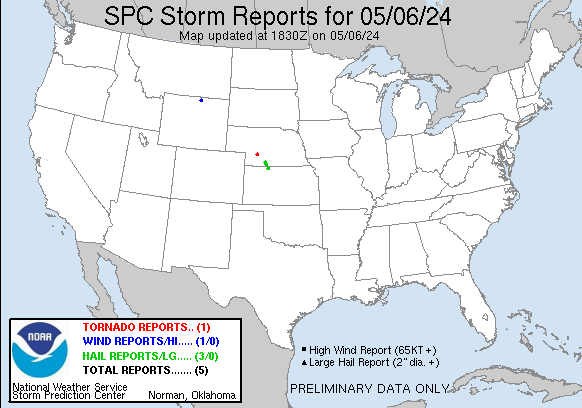
PHS scientists have created maps that combine where the High Shear and High Instability regions into one ‘Vortex Prediction’ image, shown below for 1700 UTC (and available at this website). This image below shows hourly forecasts valid at 1700 UTC, from forecasts initialized from 1100 – 1500 UTC on 6 May 2024. At 1700 UTC, the consistently-forecast most favorable environment for strong convection is over western Nebraska. That region is very close to the location of the first tornado touchdown of the day, shown below in SPC storm reports from 1830 UTC. (Imagery below courtesy Bill Smith Sr and Anthony DiNorscia, Hampton University).
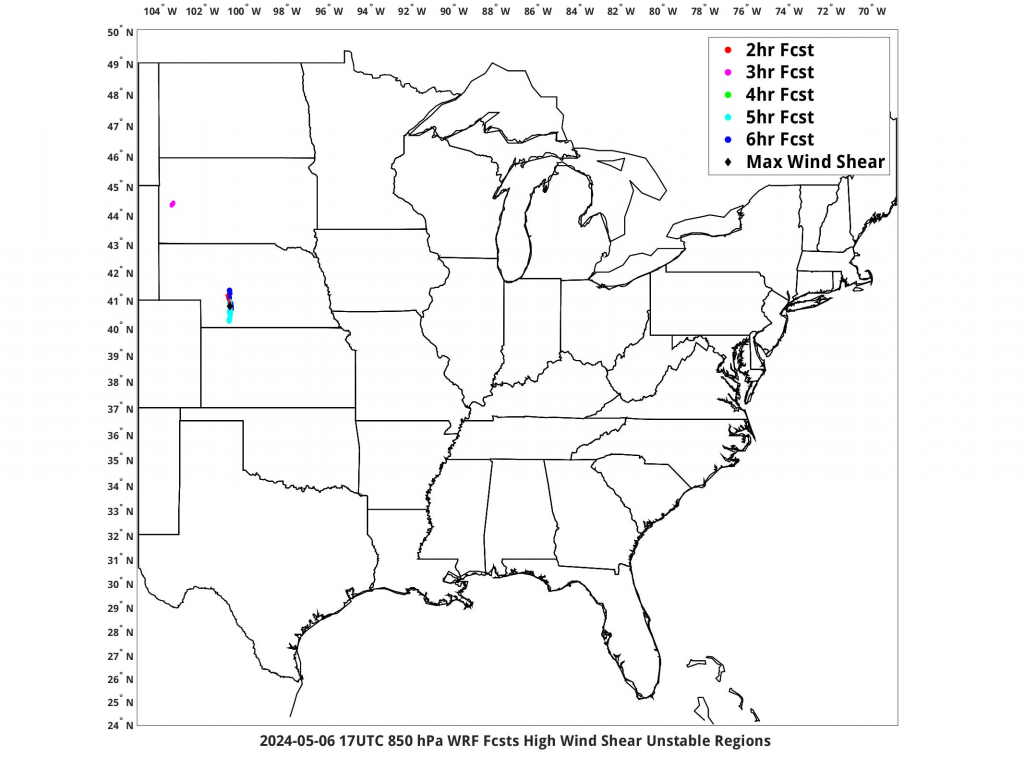
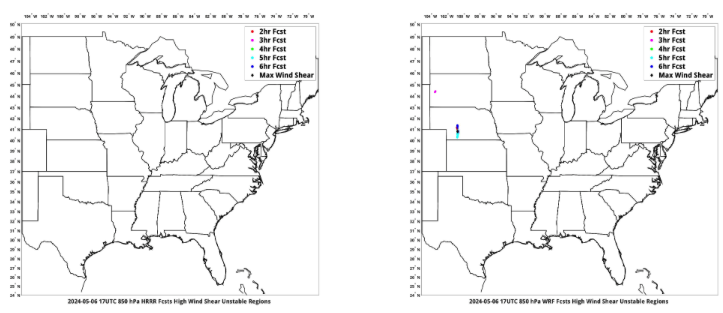
Note that the HRRR simulation (left, below) has no similar signal as the WRF simulation with assimilated PHS data.
—————
Free Secure Email – Transcom Sigma
Transcom Hosting
Transcom Premium Domains
