Arctic low north of Alaska, and its effect on ice in the Beaufort Sea
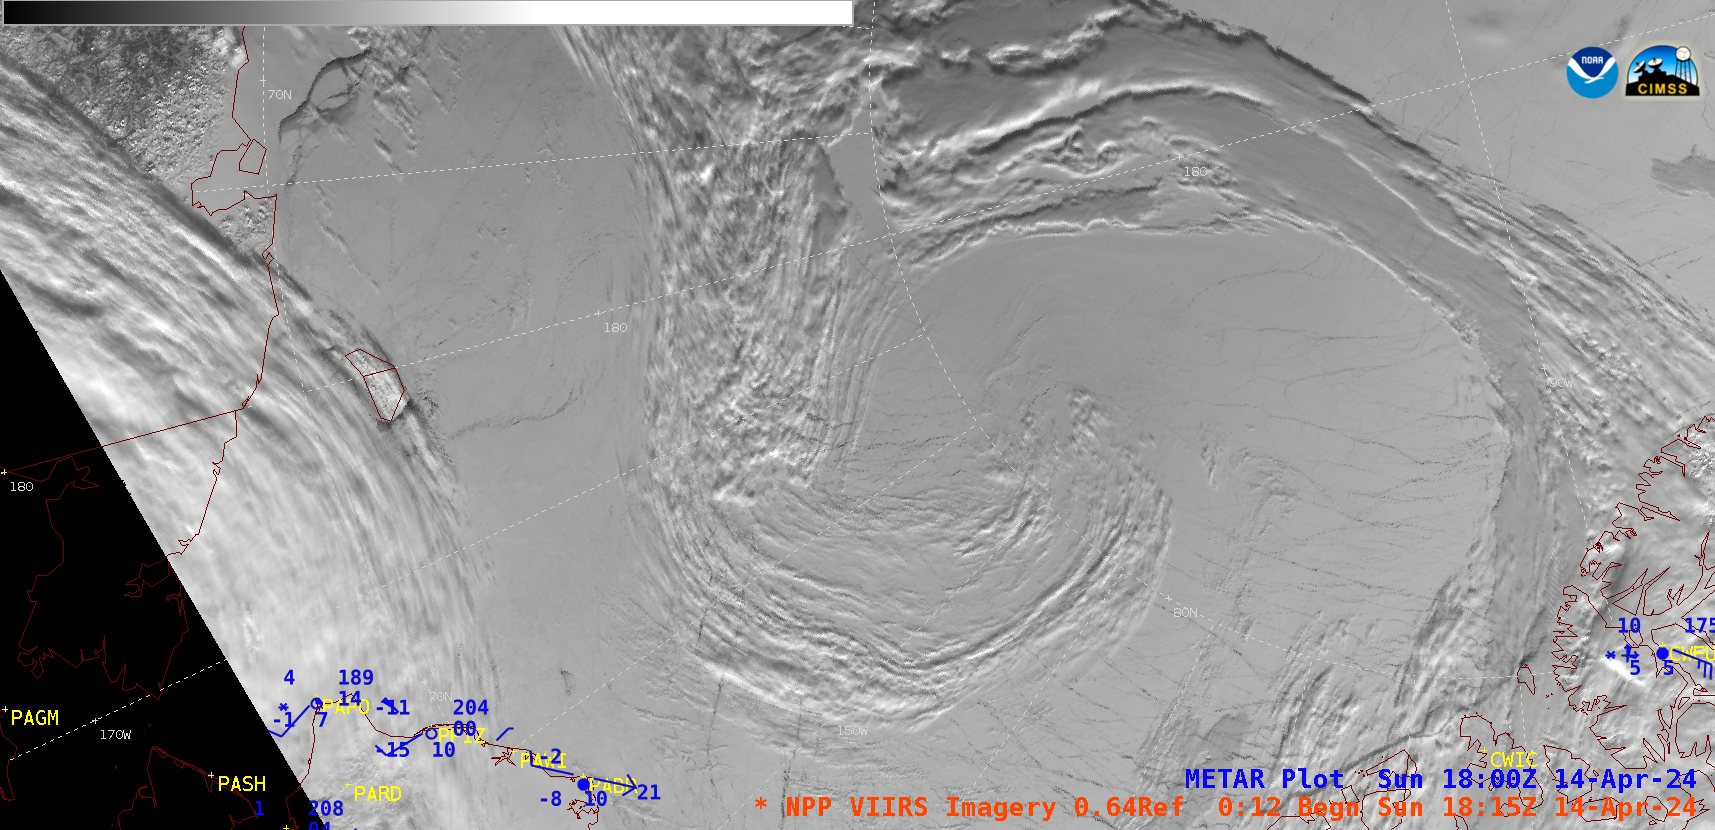
Suomi-NPP VIIRS Visible (0.64 µm) images, from 2333 UTC on 13 April to 2132 UTC on 14 April [click to play animated GIF | MP4]
A sequence of Suomi-NPP VIIRS Visible (0.64) images (above) displayed the cyclonically-curved cloud structure associated with an Arctic low pressure system (surface analyses) located between Alaska and the North Pole on 14 April 2024. A blend of Atmospheric Motion Vectors derived from NOAA-20 and NOAA-21 (below) showed the flow pattern at various altitudes around this Arctic low. Real-time polar winds derived from a variety of satellites are available here.
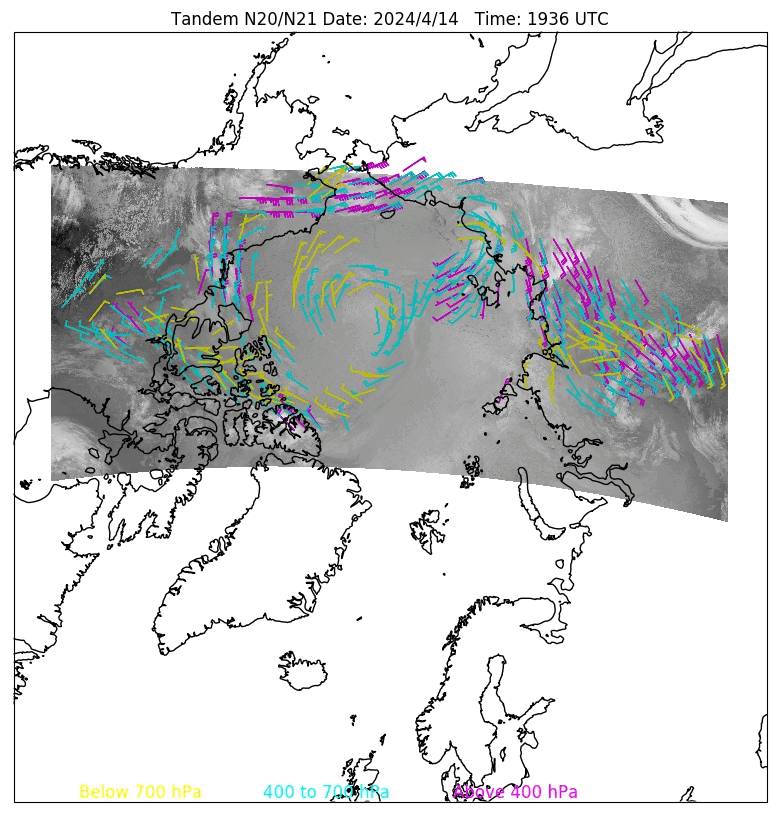
NOAA-20 and NOAA-21 Infrared images with plots of blended Atmospheric Motion Vectors derived from both satellites, from 2229 UTC on 13 April to 1936 UTC on 14 April (credit: Rich Dworak, CIMSS) [click to play animated GIF | MP4]
The pressure gradient along the southern edge of this low was responsible for strong west-southwest winds across parts of Alaska’s North Slope — for example, a plot of surface report data from Utqiagvik (Barrow, station identifier PABR) showed wind gusts of 20-24 knots, with intermittent reductions in visibility due to blowing snow (below).
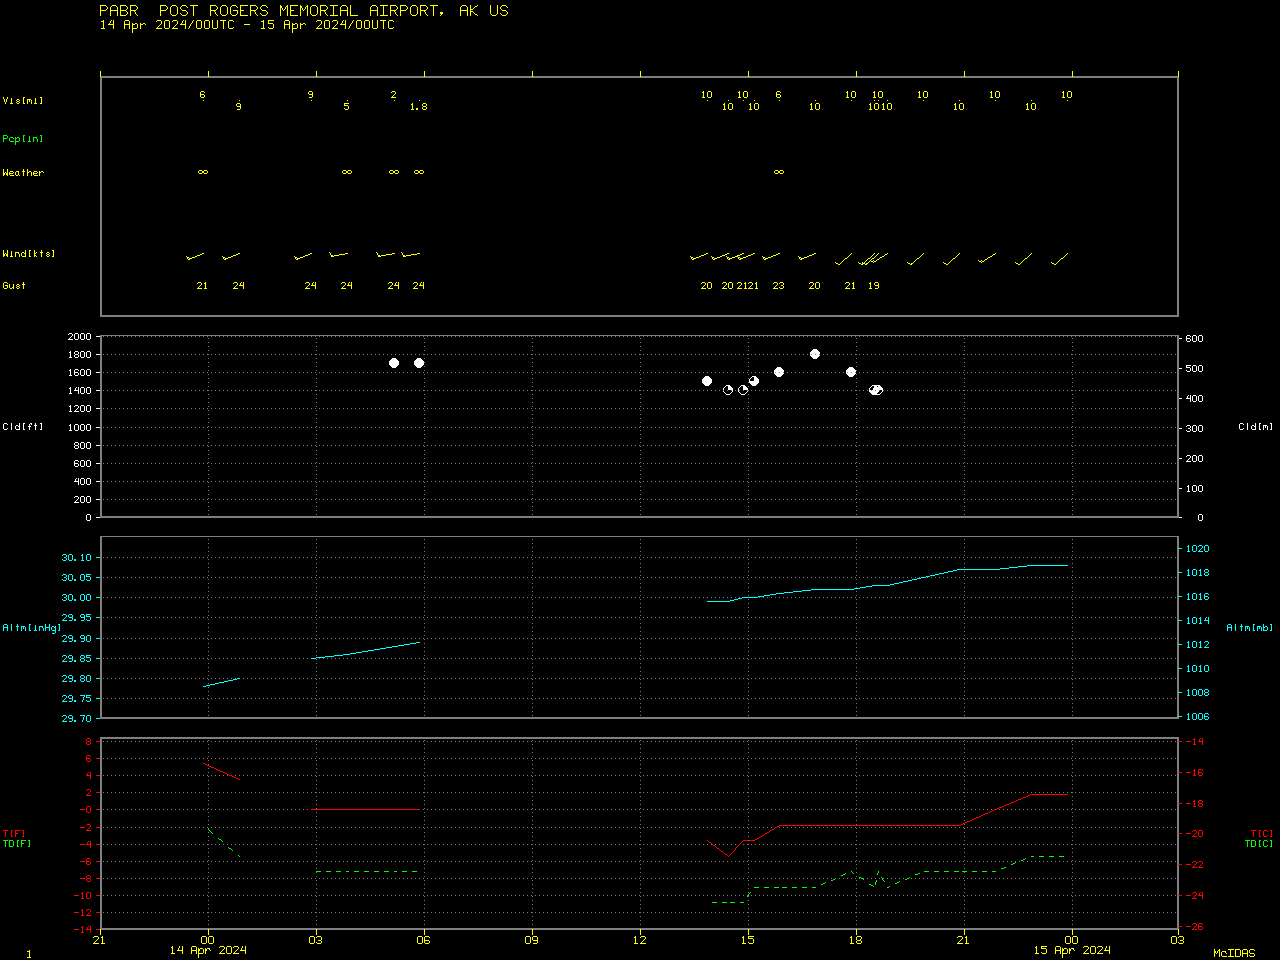
Plot of surface report data from Utqiagvik (Barrow) [click to enlarge]
A closer view of Suomi-NPP VIIRS Visible images centered over the Beaufort Sea (below) showed the effect of these strong westerly winds on the deformation of numerous ice leads off the north coast of Alaska. In addition, narrow cloud streets highlighted areas where blowing snow was likely occurring over the sea ice.
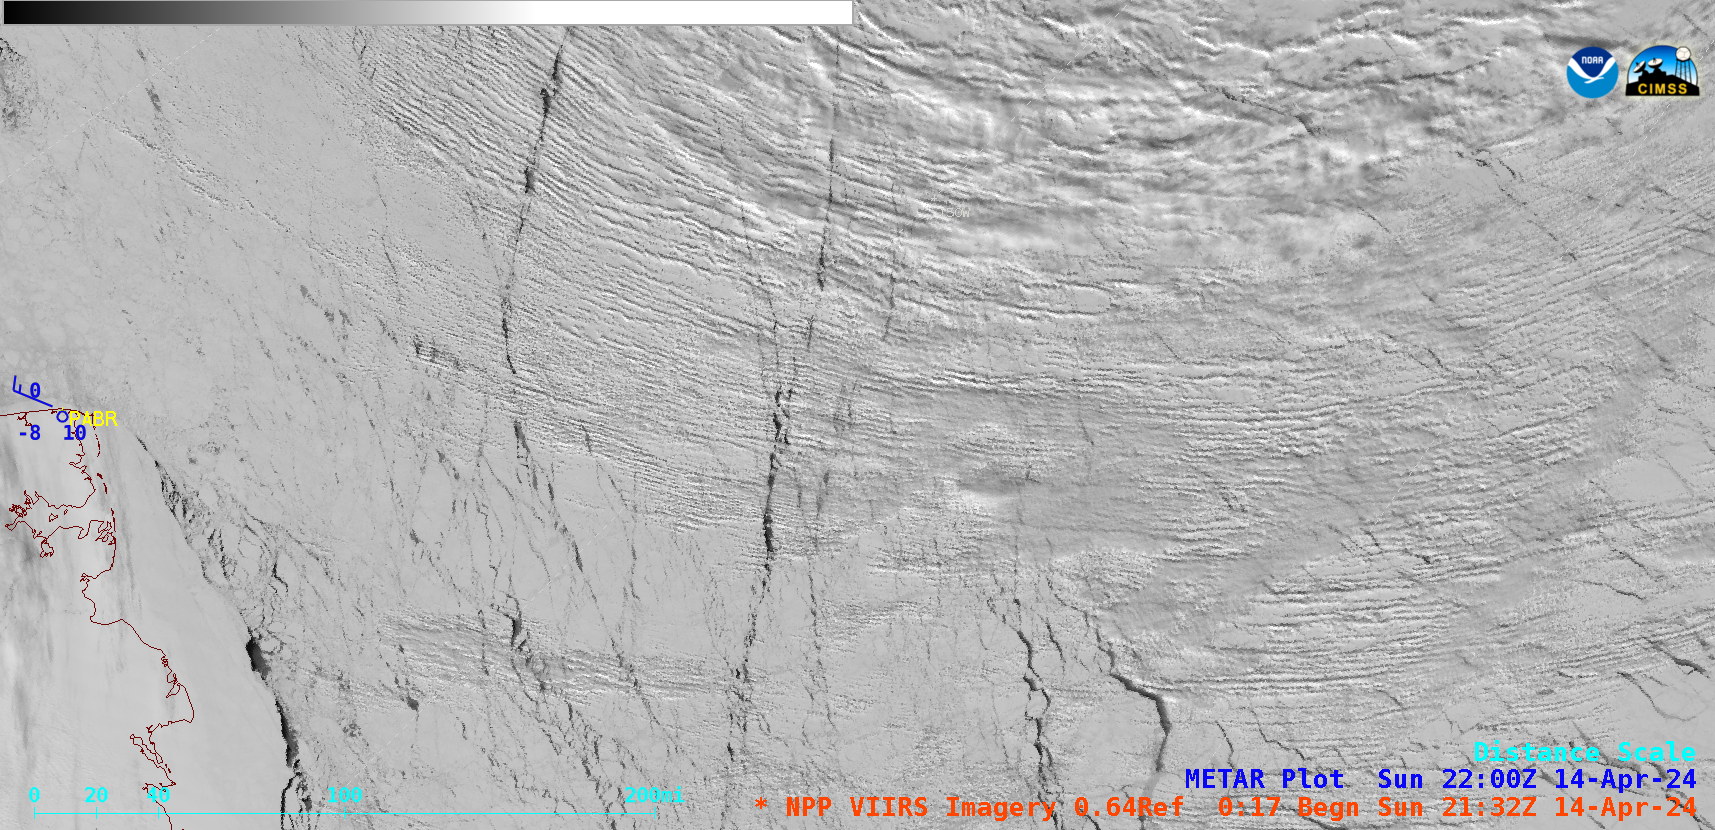
Suomi-NPP VIIRS Visible (0.64 µm) images, from 1459 UTC to 2132 UTC on 14 April [click to play animated GIF | MP4]
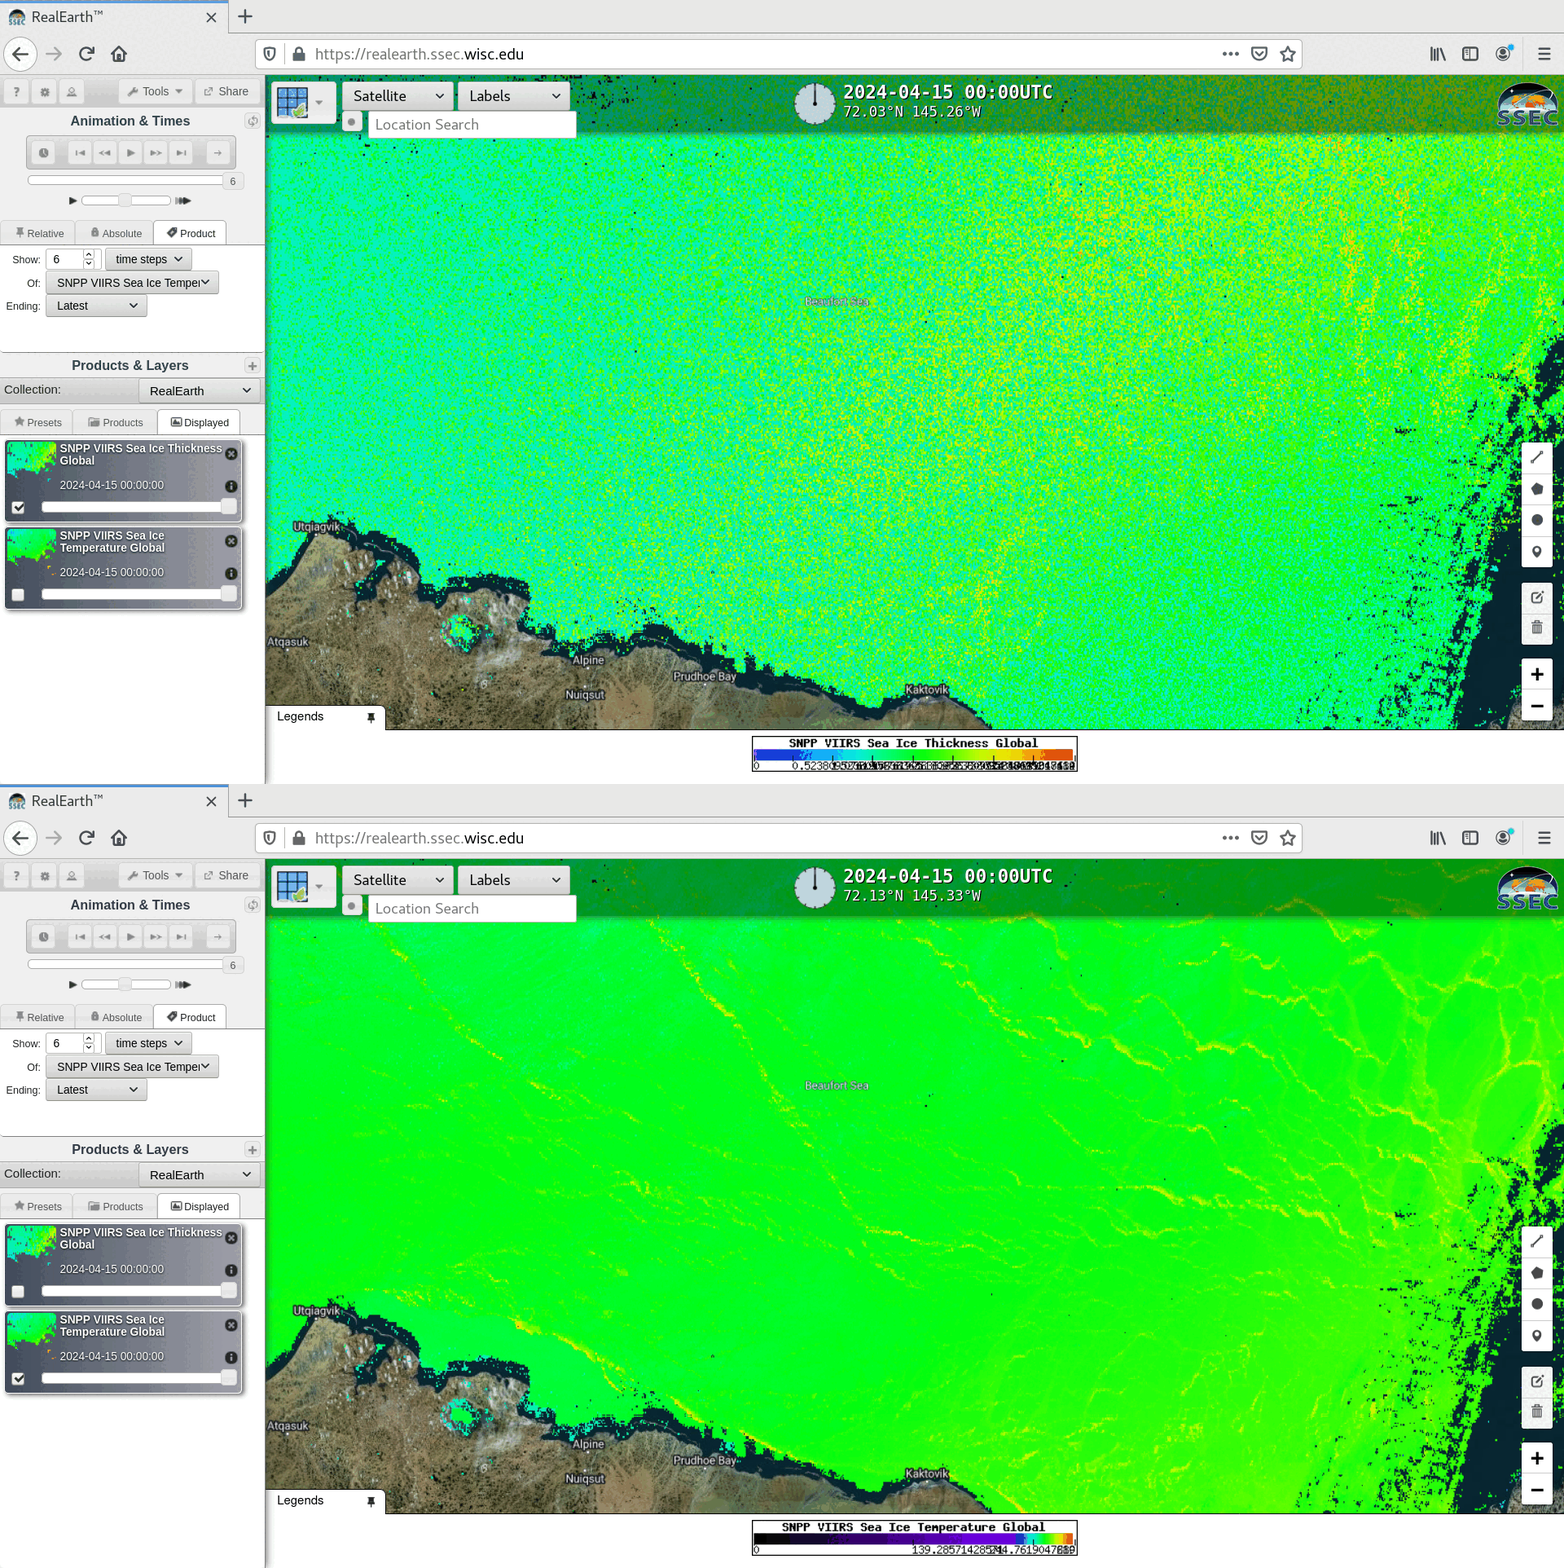
Suomi-NPP VIIRS Sea Ice Thickness and Sea Ice Temperature derived products at 0000 UTC on 15 April [click to enlarge]
A toggle between Suomi-NPP VIIRS Sea Ice Thickness and Sea Ice Temperature derived products at 0000 UTC on 15 April — displayed using RealEarth — is shown above. Probing these two products indicated values of 3.3 m and 257.3 K, respectively (below).
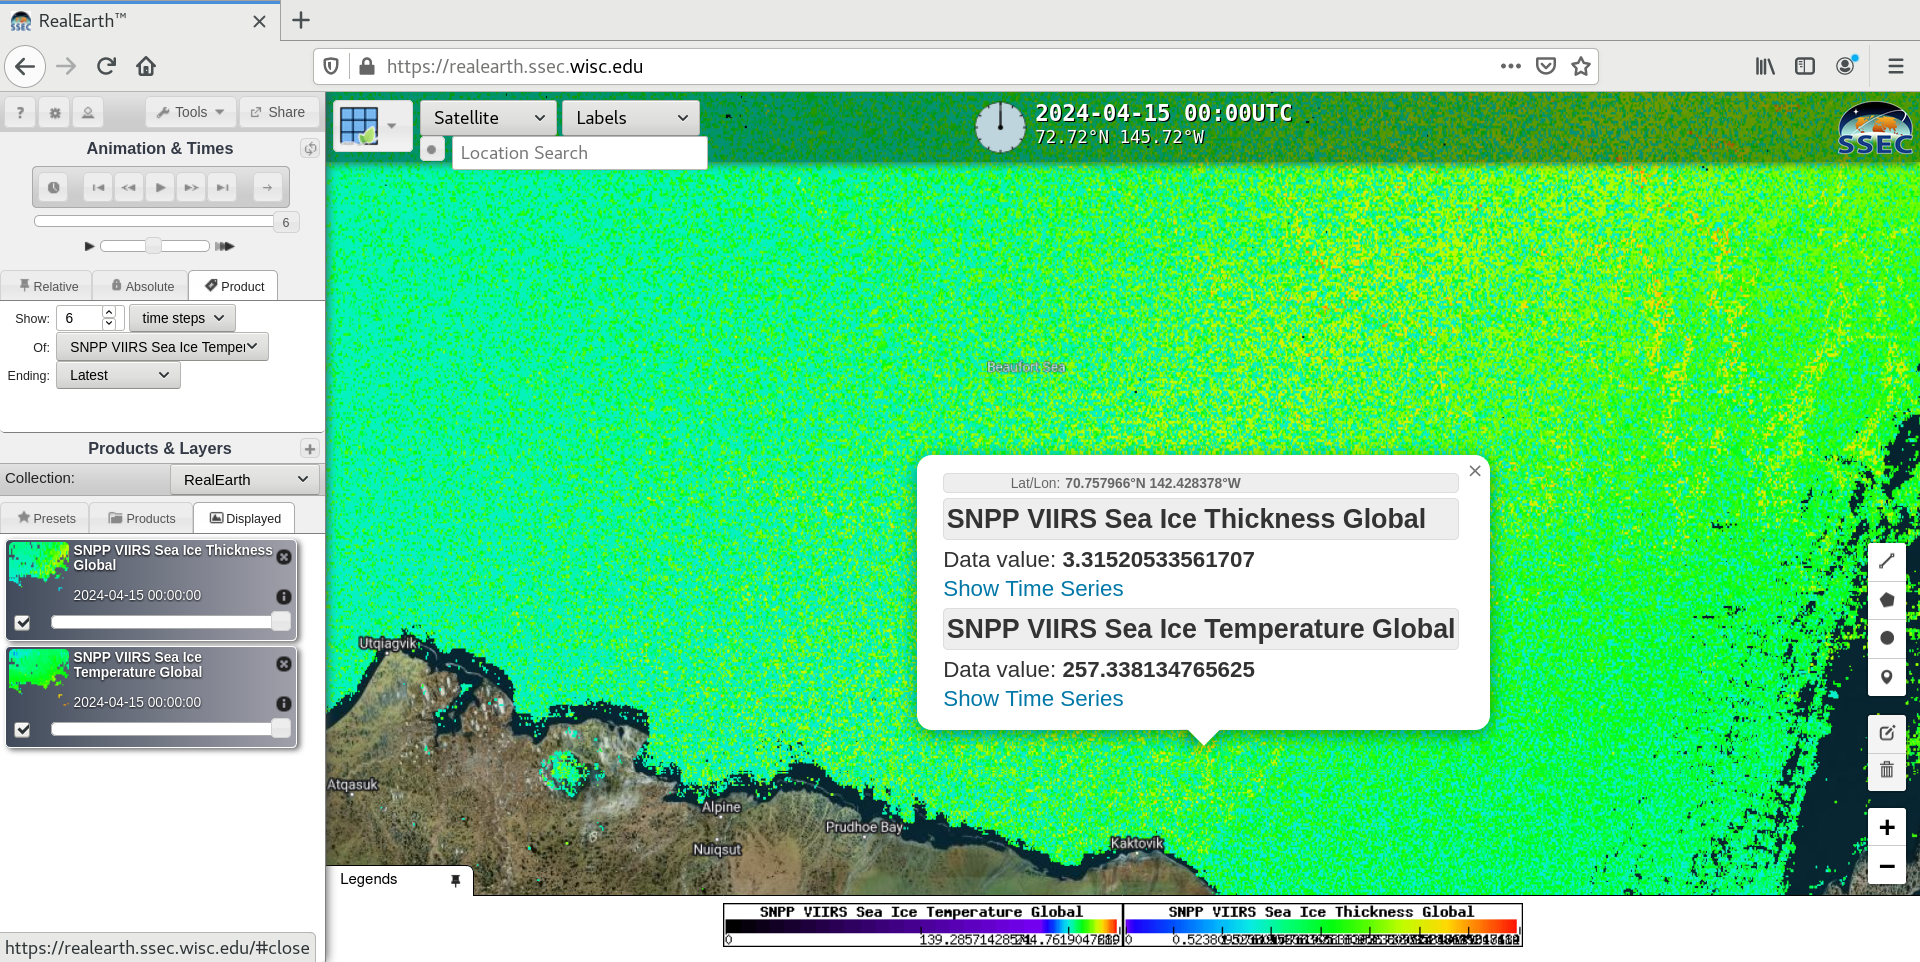
Probed values of Suomi-NPP VIIRS Sea Ice Thickness and Sea Ice Temperature derived products at 0000 UTC on 15 April [click to enlarge]
Daily composite images of the Sea Ice Temperature, Sea Ice Thickness and Sea Ice Age derived products from NOAA-20, NOAA-21 and Suomi-NPP (source) on 14 April are shown below.
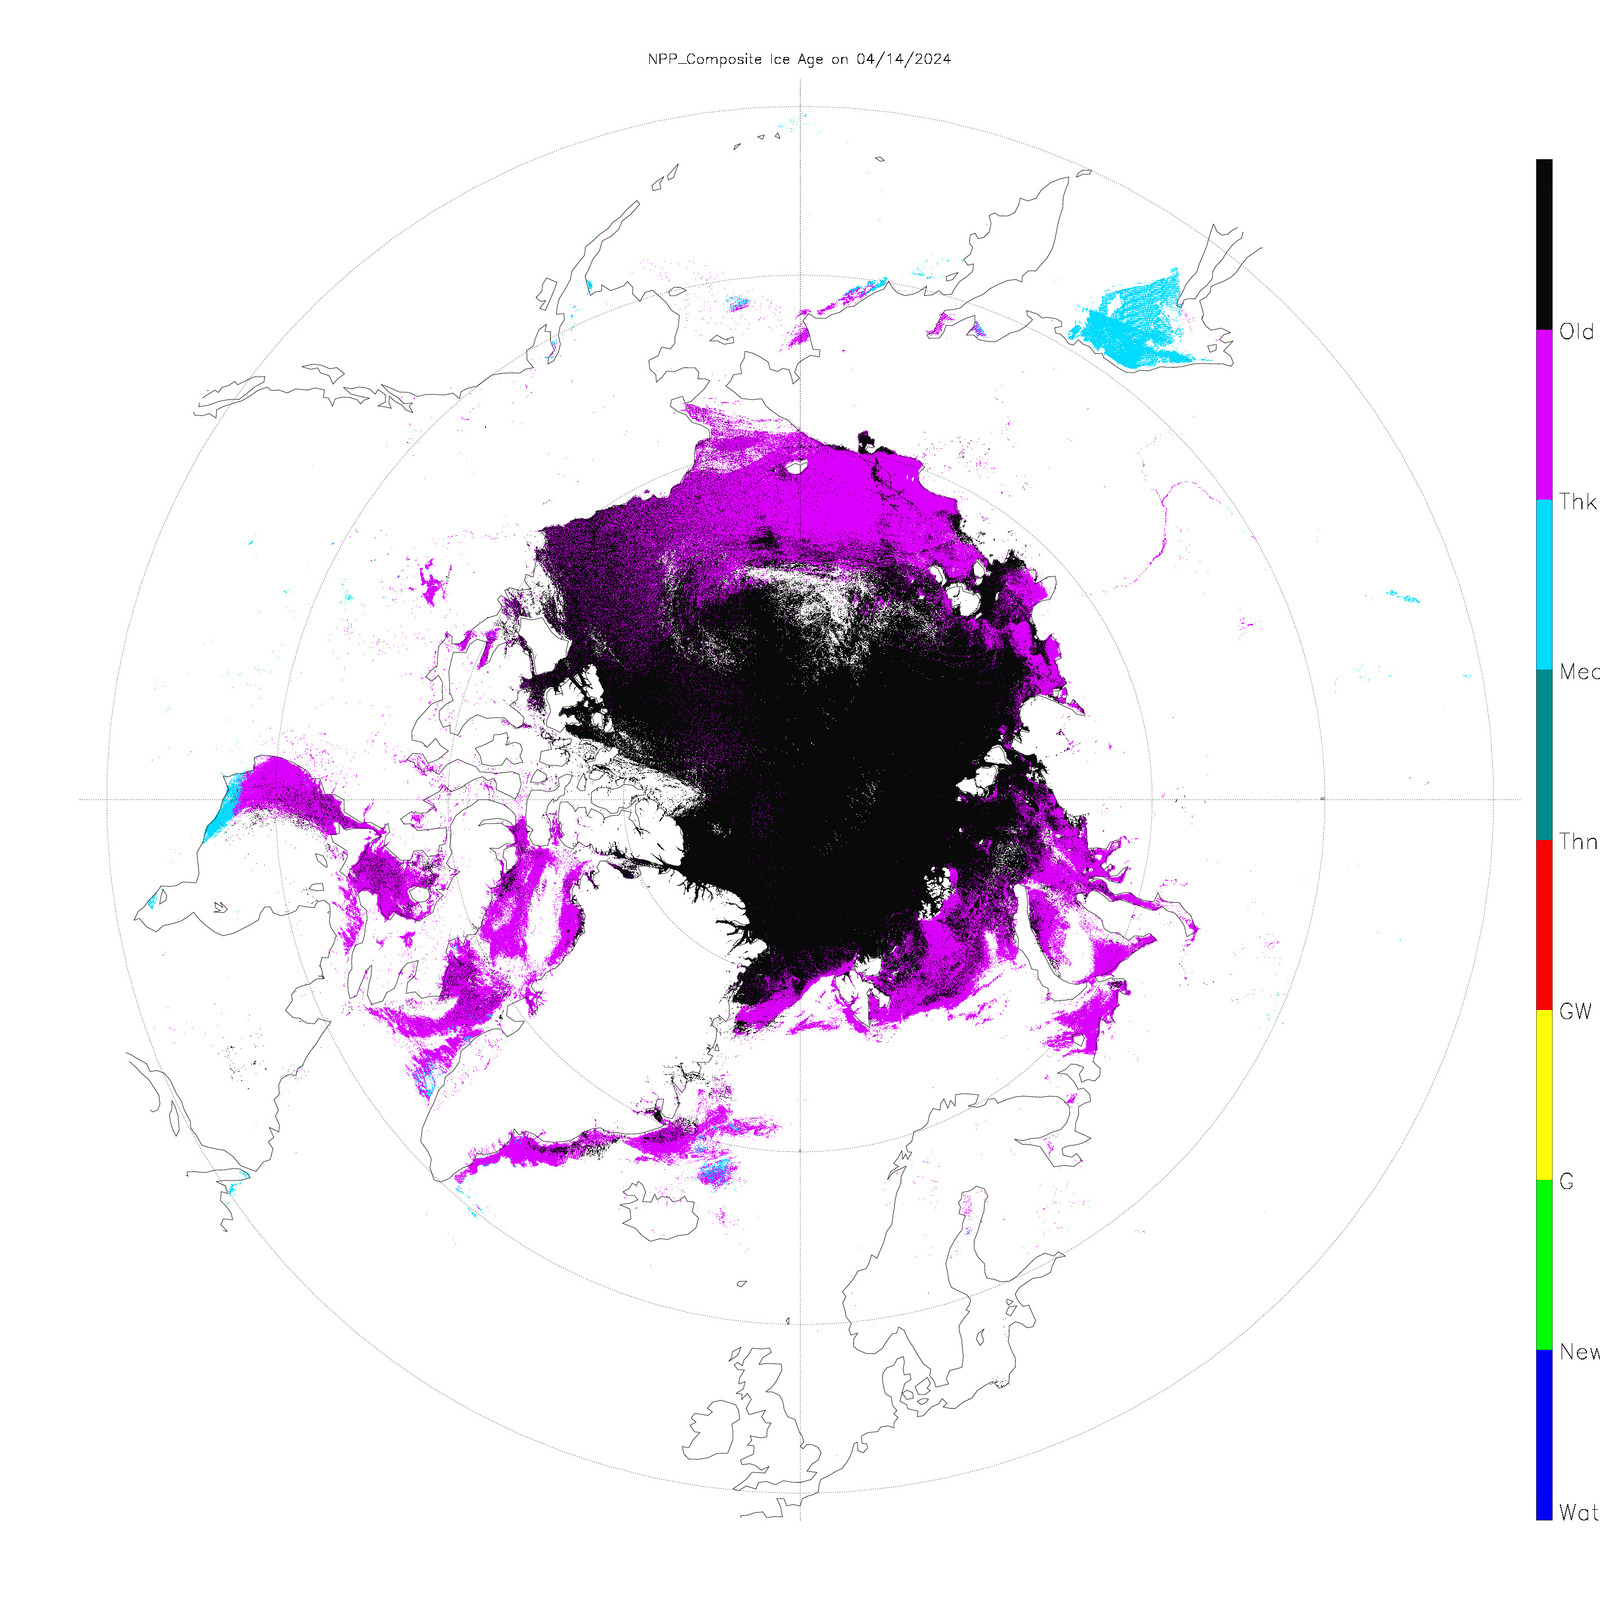
Daily composite images of the Sea Ice Temperature, Sea Ice Thickness and Sea Ice Age derived products from NOAA-20, NOAA-21 and Suomi-NPP on 14 April [click to play animated GIF | MP4]
—————
Free Secure Email – Transcom Sigma
Transcom Hosting
Transcom Premium Domains
