
Grampians bushfire in southeast Australia produces a pyrocumulonimbus cloud

JMA Himawari-9 “Red” Visible (0.64 µm, top), Shortwave Infrared (3.9 µm, center) and “Clean” Infrared Window (10.4 µm, bottom) images from 0300-0510 UTC on 4th February, with plots of surface reports at Melbourne YMML [click to play animated GIF | MP4]
10-minute JMA Himawari-9 AHI “Red” Visible (0.64 µm), Shortwave Infrared (3.9 µm) and “Clean” Infrared Window (10.4 µm) images (above) showed the formation of a pyrocumulonimbus (pyroCb) cloud that was spawned by a bushfire in Grampians National Park in far southeast Australia on 4th February 2025. The pyroCb exhibited cloud-top 10.4 µm infrared brightness temperatures (IRBTs) in the -40s C (denoted by shades of blue to cyan), attaining a minimum IRBT of -49.9º C at 0430 UTC. This temperature roughly corresponded to an altitude around 11 km — not far below the tropopause — according to rawinsonde data from Melbourne: (plot | text). The pyroCb cloud drifted southeast, eventually passing just south of Melbourne Airport (YMML).
Himawari-9 True Color RGB images created using Geo2Grid (below) displayed the pyroCb cloud that was being transported southeastward — and dense smoke (shades of tan) was evident in the vicinity (and immediately downwind) of the Grampians bushfire.

JMA Himawari-9 True Color RGB images, from 0250-0600 UTC on 4th February [click to play animated GIF | MP4]
As a surface trough of low pressure was moving east-northeastward across the state of Victoria during that time period (surface analyses), strong southerly winds behind the trough axis (surface observations at Melbourne) helped to intensify the Grampians fire complex — and the pyroCb cloud developed just after the trough passed through the area. Himawari-9 Fire Temperature RGB images (below) revealed (1) the northward expansion of the Grampians bushfire following the ~0300 UTC trough passage (along with flare-up of new fires to the NW), and (2) the pyroCb formation just after the time of the trough passage (0340 UTC image). Note that in the Himawari-9 True Color RGB images shown above, the trough passage also initiated a northward transport of boundary layer smoke from the bushfire source region.
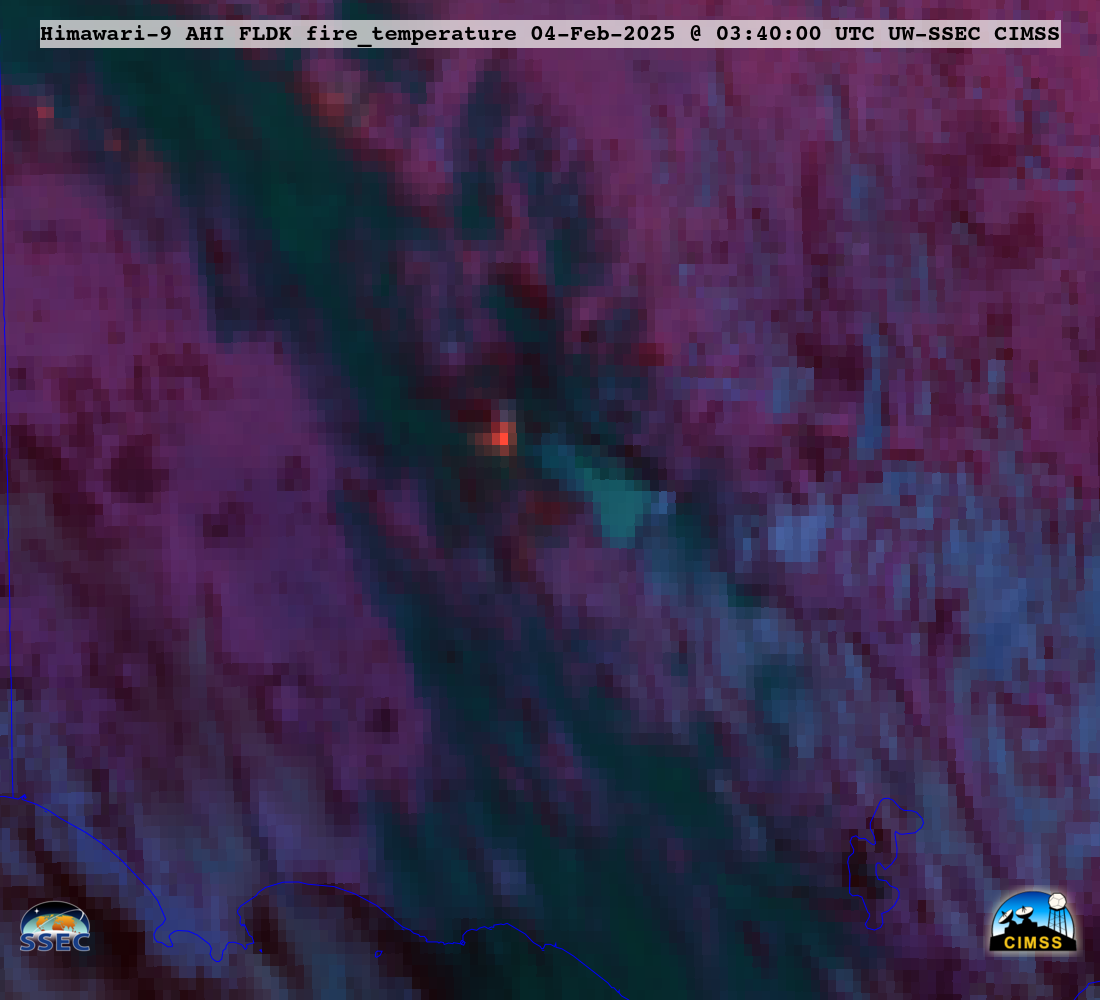
Himawari-9 Fire Temperature RGB images, from 2100 UTC on 3rd February to 1100 UTC on 4th February [click to play animated GIF | MP4]
—————
Free Secure Email – Transcom Sigma
Transcom Hosting
Transcom Premium Domains