
What’s the Weather going to be on …
“All weather is local” (and can change quickly) and satellites allow the monitoring of a range of phenomena on fine time and space scales. This includes, but not limited to air quality, aviation, convective initiation, the cryosphere, fire detection, fog detection, heavy rain, lightning, marine weather, tropical cyclones, volcanic activity, winter weather and more.
There are a number of online resources to better understand what the weather is going to be like at a given place and time. What resources to look at will depend on the location and length of the forecast ahead of time. For example, if the date is too far in the future, then climatology may be the best tool, while satellite imagery may be the best for a short-term cloud cover “nowcast”.
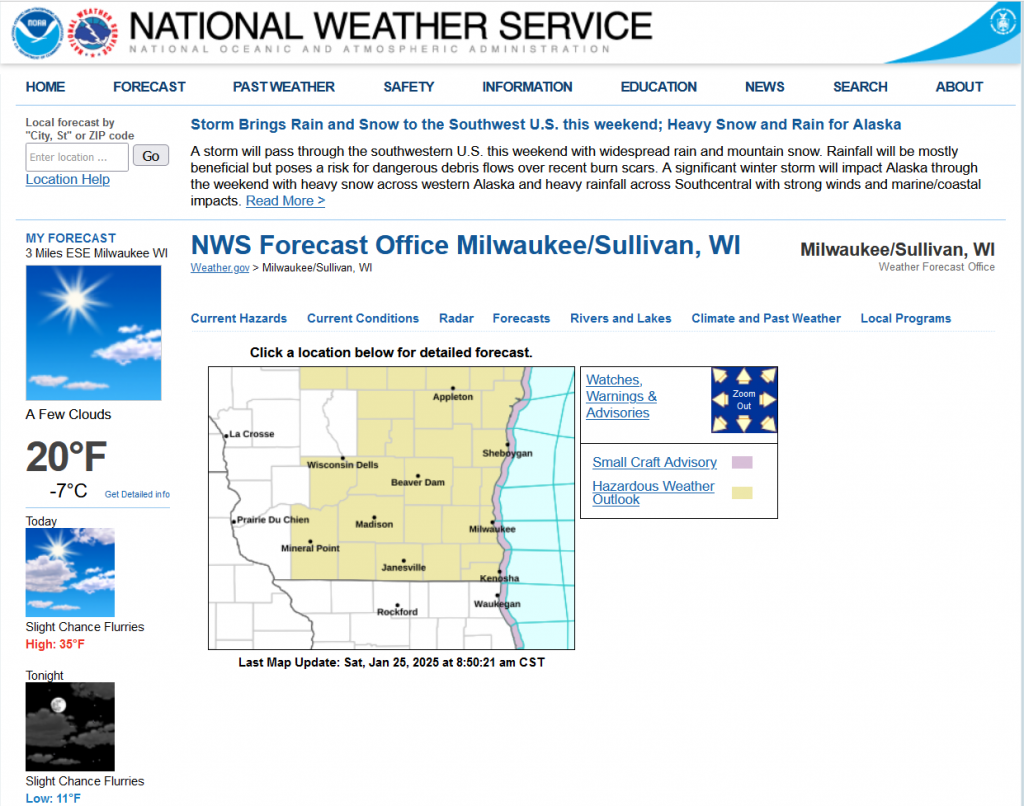
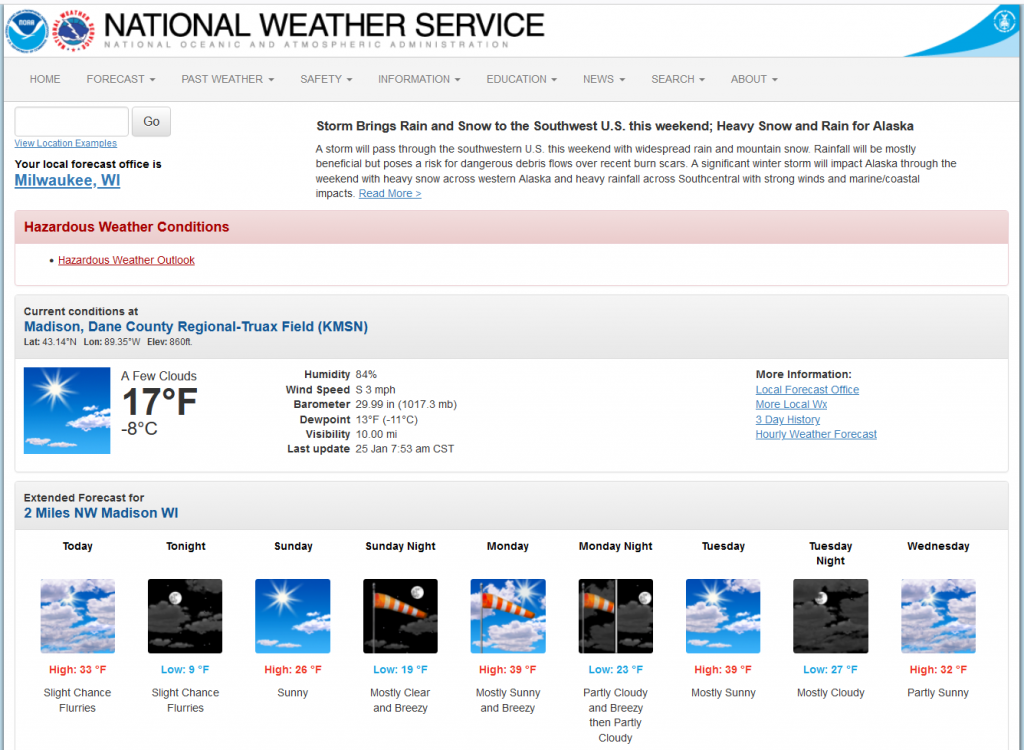
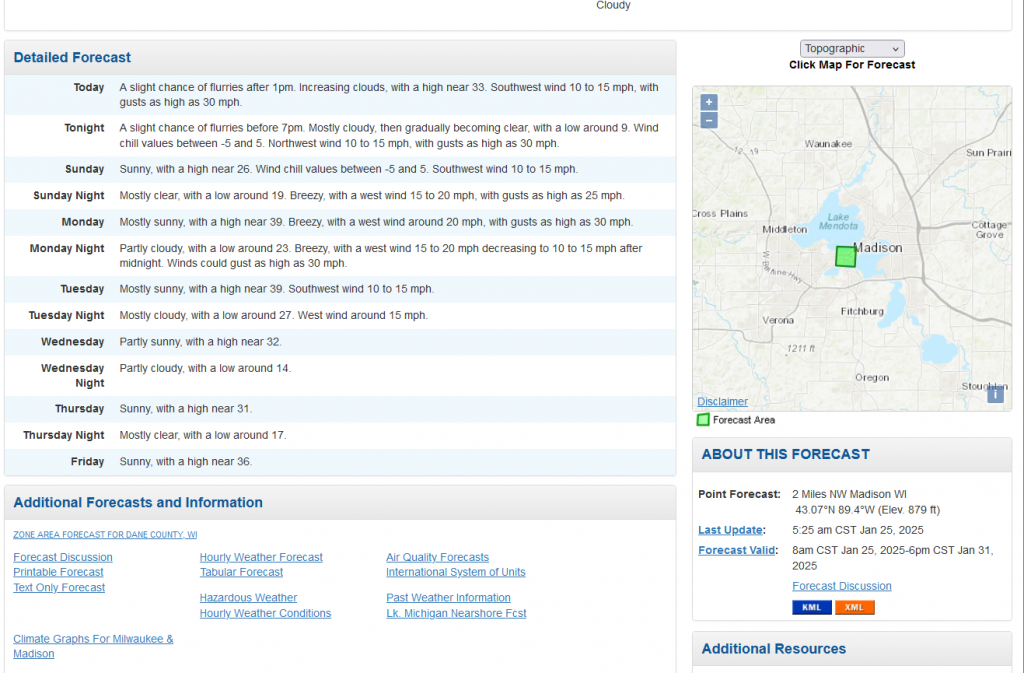
The best place to start might be your local NOAA NWS Weather Forecast Office web page (eg, MKX), reachable via a national map.
Climatology
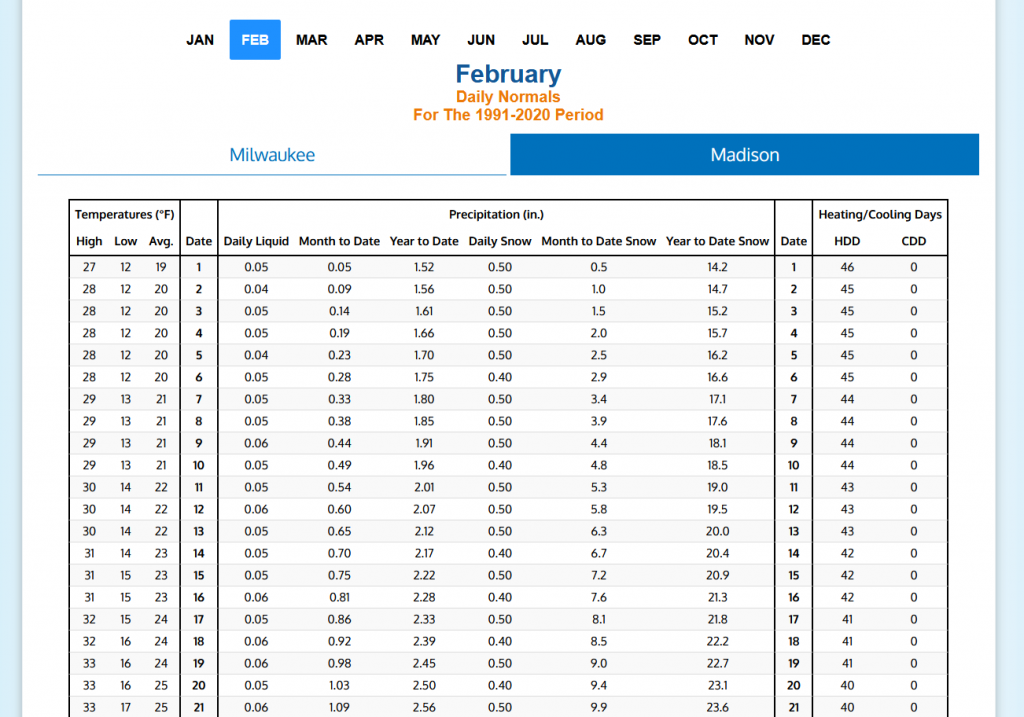
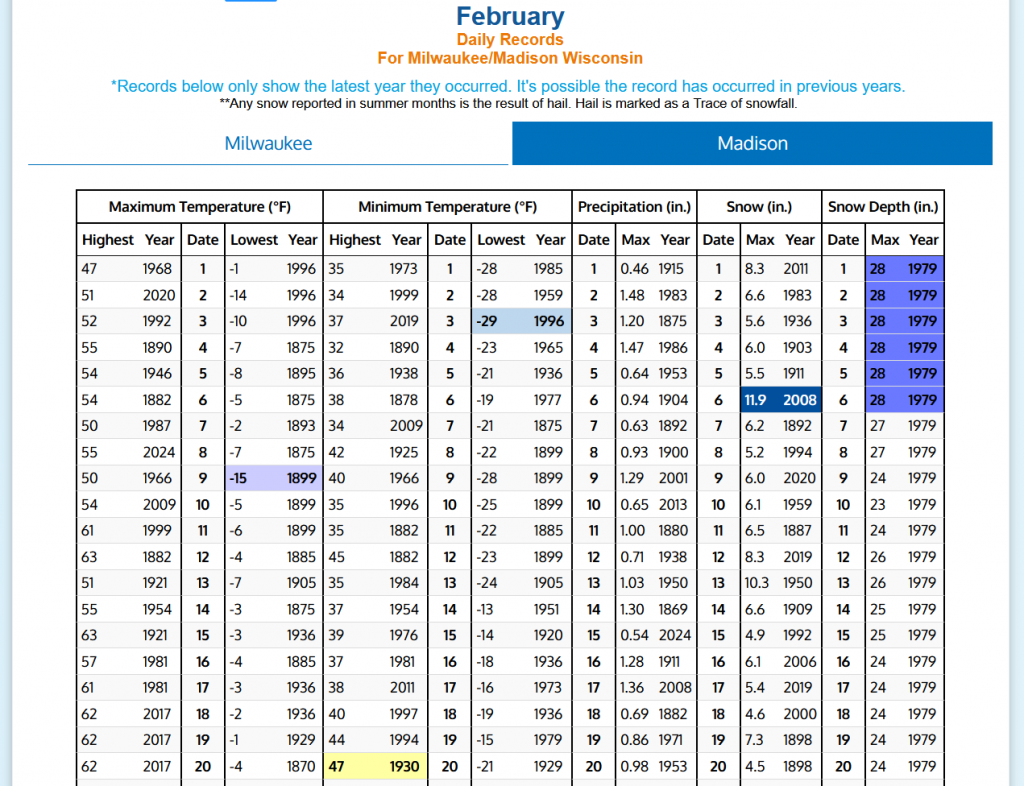
Years or Months before the event one is interested in, climatology shows what has happened on this date in the past. It’s best to look at not only the averages (for temperatures and precipitation), but also the extremes. Click on “Climate Graphs”. Or visit the CPC page.
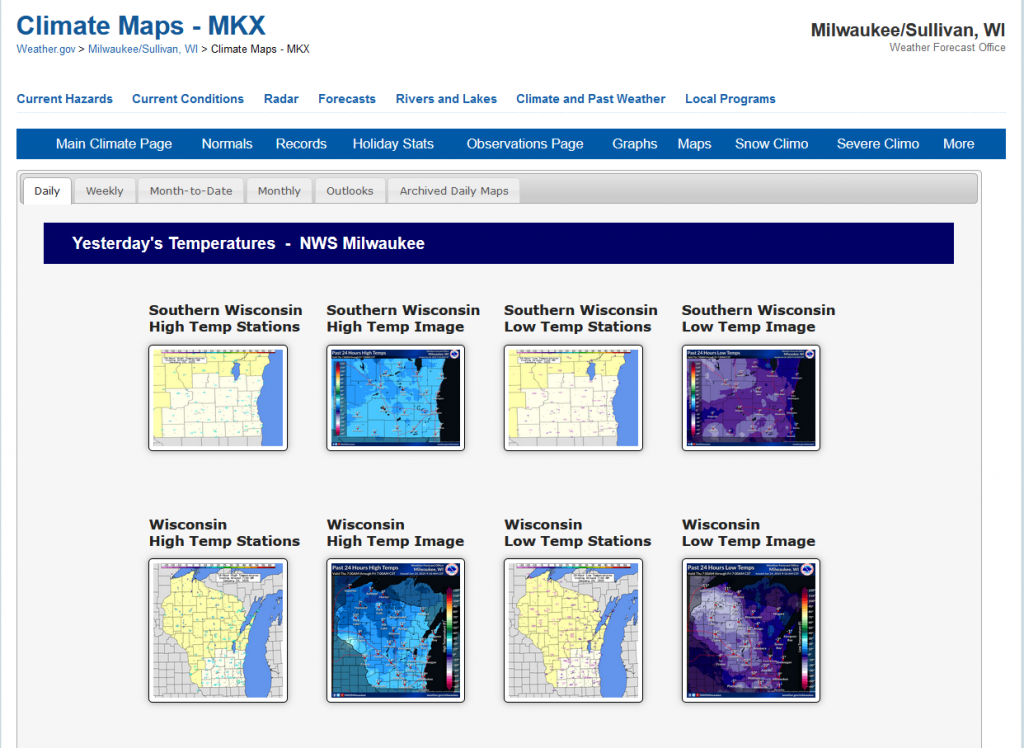
Click on “Normals” or “Records”, then chose the City and month of interest.
Long-term Outlooks
There are a number of longer-term outlooks for temperature and precipitation, including 3 months ahead of time, as was as weeks ahead of time. Start by clicking the “Outlooks” tab.

Within a Week
A week ahead of a given event is covered by global forecast models. These models leverage many observations, including satellite observations. A few days ahead of a given event is covered by regional forecast models. These models leverage many observations, including satellite observations. In fact, satellites are the backbone of NWP observations. Guidance from both of these can be found on the WFO home page, or the hourly-weather graph.
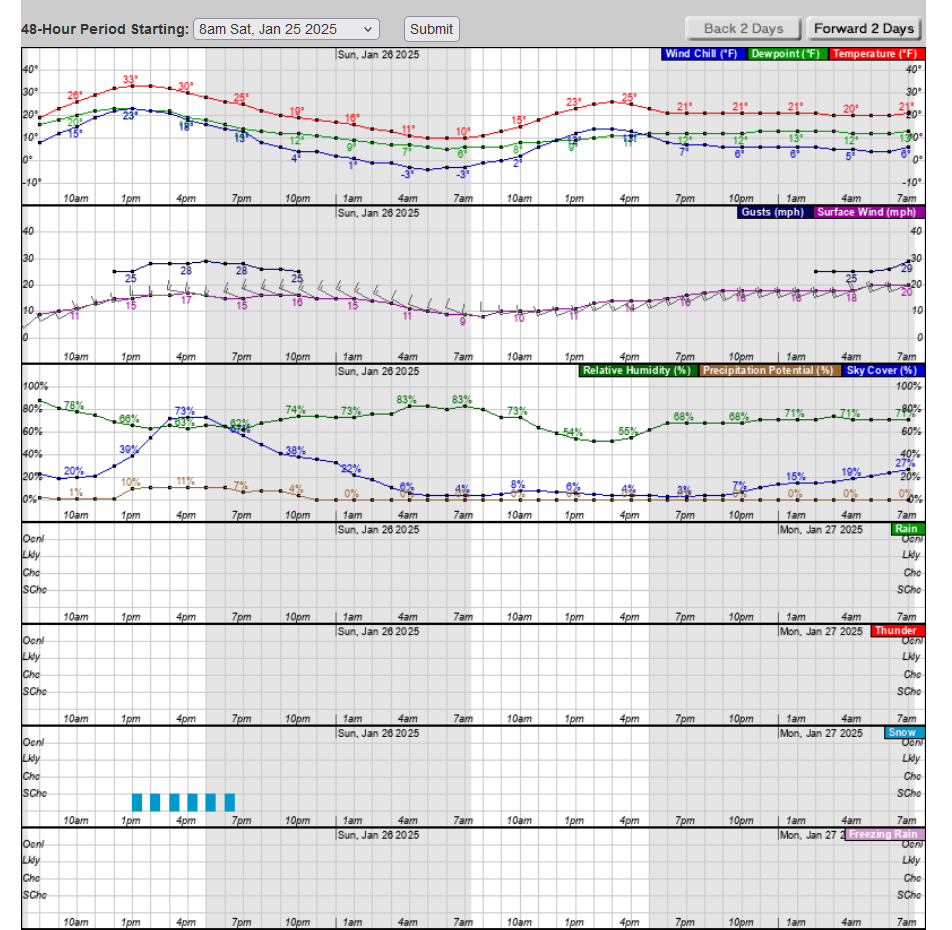
More on how to read the hourly weather graphs from the NWS.
Same day
The closer to the time of the event, the more one can view current weather, including satellite images. This includes integrated products like the research probability of severe weather or lightning, fires products.
More on LightningCast.
Many states have a “mesonet” of surface observations, including in Wisconsin (maps).
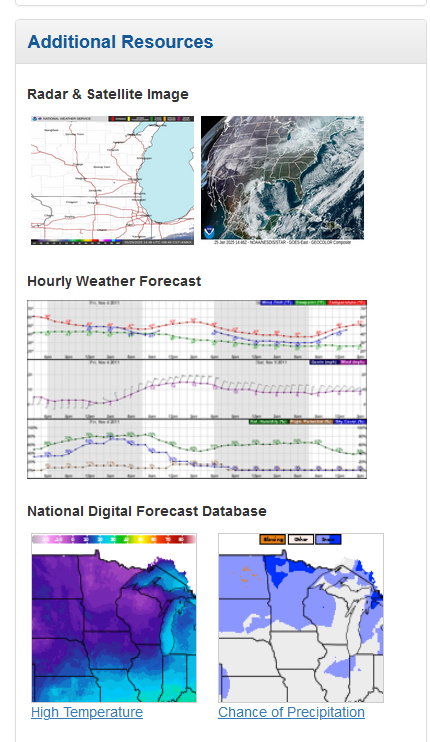
More satellite imagery from NOAA/STAR, UW/SSEC, UW/GeoSphere and CSU/CIRA.
Time of the event
While “looking out the window” is good advice, even better might be to go outside and check. Of course the weather can change quickly, so keep an eye on rapidly changing conditions. One can also check out a number of roof top cameras, for example those at UW/SSEC and AOS.
—————
Free Secure Email – Transcom Sigma
Transcom Hosting
Transcom Premium Domains