
VIIRS, ABI, and NUCAPS over Alaska
VIIRS infrared imagery (I05 imagery at 11.45 µm) from the NOAA-21 (mislabeled, alas, at Suomi NPP) show high-resolution infrared imagery at about 90-minute time-steps. Cold Cloud tops associated with a low pressure system bringing light snow to northern Alaska are apparent — but during the gap from 00-08 UTC on 16 October when NOAA-21 does view Alaska, the satellite signature of the system degrades significantly. GOES-18 ABI data is consistently viewing Alaska (and, indeed, Mesoscale Domain #2 from GOES-18 by default gives 1-minute imagery over Alaska), and those scenes time-matched to the VIIRS imagery above (shown below; one could show an animation with much finer time resolution with ABI to show exactly when the organization of the system changed most profoundly.) also show the change in organization to the system over Alaska. This animation (from this website) shows a surface analysis at 12-h time steps on the 15th and 16th.
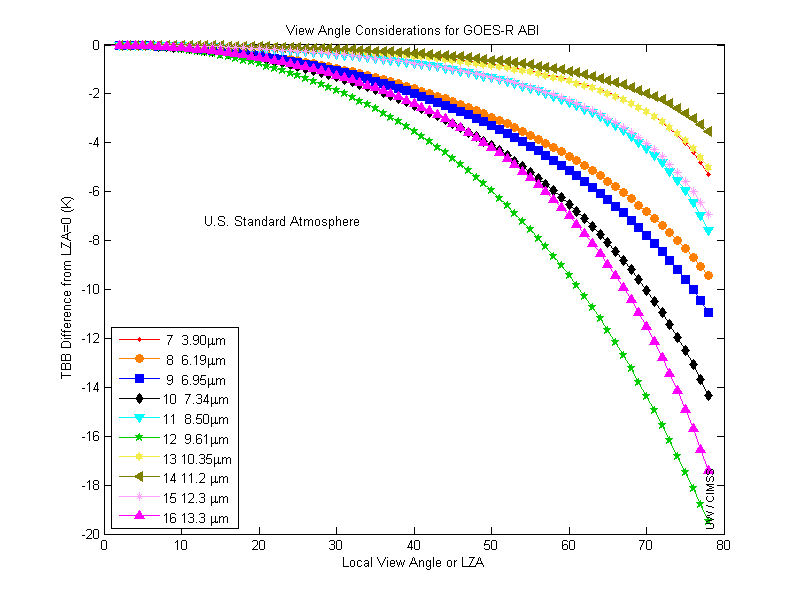
The two animations above have different scaling and different enhancements, although they have the same endpoints. The ABI imagery is uniformly colder, however, even though the resolution is much finer for VIIRS data. One reason for the difference is limb-cooling effects. The plot below shows how ABI Brightness Temperatures vary as a function of view angle. A very slanted view of the surface, or of a cloud, means a path from the near-surface to the satellite that passes through a lot of the cold upper tropopshere, leading to brightness temperatures.
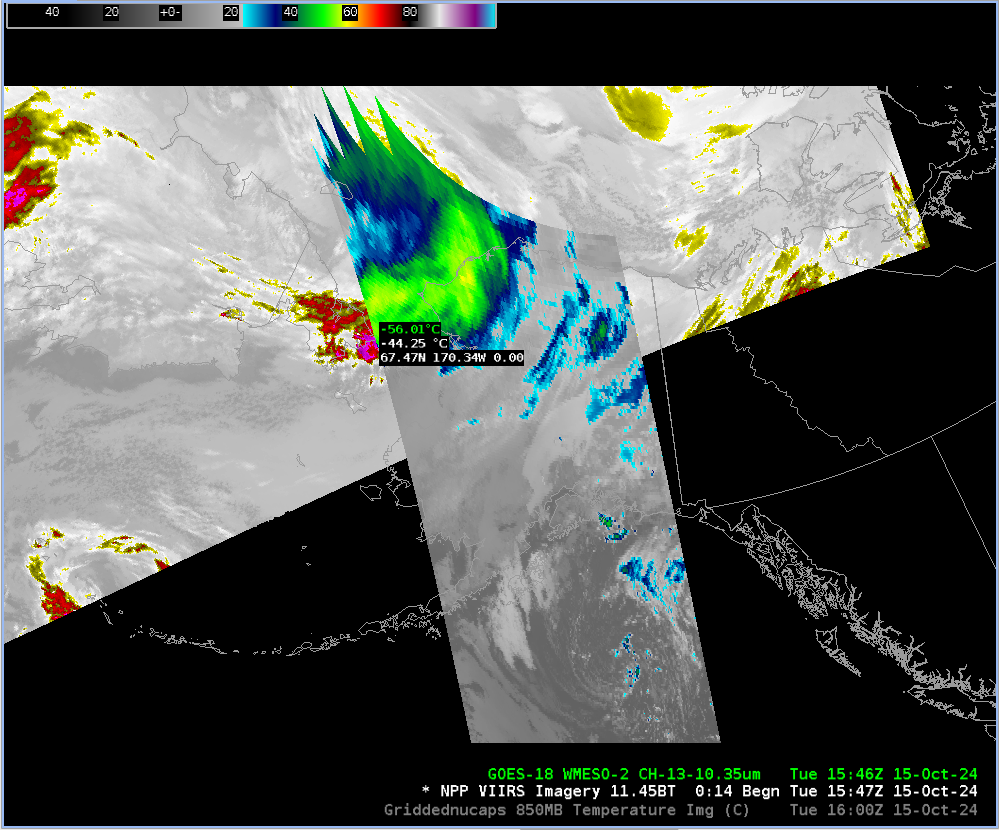
NOAA-20, NOAA-21 and Metop-C satellites all carry infrared and microwave sounders; data from those instruments can be used to create vertical profiles (NUCAPS Profiles) of temperature and humidity, and those profiles can be gridded to provide horizontal swaths of thermodynamic variables (i.e., ‘Gridded NUCAP’ fields). The animation shows estimates of 850-mb temperatures in swaths over/near Alaska between 1600 UTC on 15 October 2024 and 1400 UTC 16 October 2024. Temperatures colder than -15oC are widespread over northern Alaska and the Arctic Ocean.
Gridded NUCAPS fields are available outside of AWIPS at this site, and also here.
—————
Free Secure Email – Transcom Sigma
Transcom Hosting
Transcom Premium Domains