
Tornado in Buffalo New York
GOES-16 Band 2 Imagery from Mesoscale Sector 1, from the CSPP Geosphere site, above (click here for an animation with state/country borders), shows convection developing along the northern shore of Lake Erie and moving into Buffalo. One of these convective towers generated a weak tornado (storm report) at 1649 UTC.
The large-scale environment on this day was not expected to generate tornadoes. The (1300 UTC) Convective Outlook from the Storm Prediction Center, below, in a toggle with the tornado probabilities, showed a marginal risk, and very low tornado probabilities.
GOES-16 Day Cloud Phase Distinction RGB imagery, below, shows the glaciation of the developing convection as it moves out of Ontario, across extreme northern Lake Erie and into New York: the color in the RGB changes from green/cyan to yellow/orange. Note also the large-scale surface convergence in the plotted surface observations: west-southwesterly flow to the south of the developing line, west or west-northwest flow to the north of the developing line.
NOAA/CIMSS ProbSevere (v3) is a Machine-Learning tool that estimates the probability of severe weather. How did it perform in this environment? The animation below shows the ProbSevere polygon from 1535 UTC through 1710 UTC. ProbSevere highlights the cell that produced the tornado, and consistently tracks it through Buffalo.
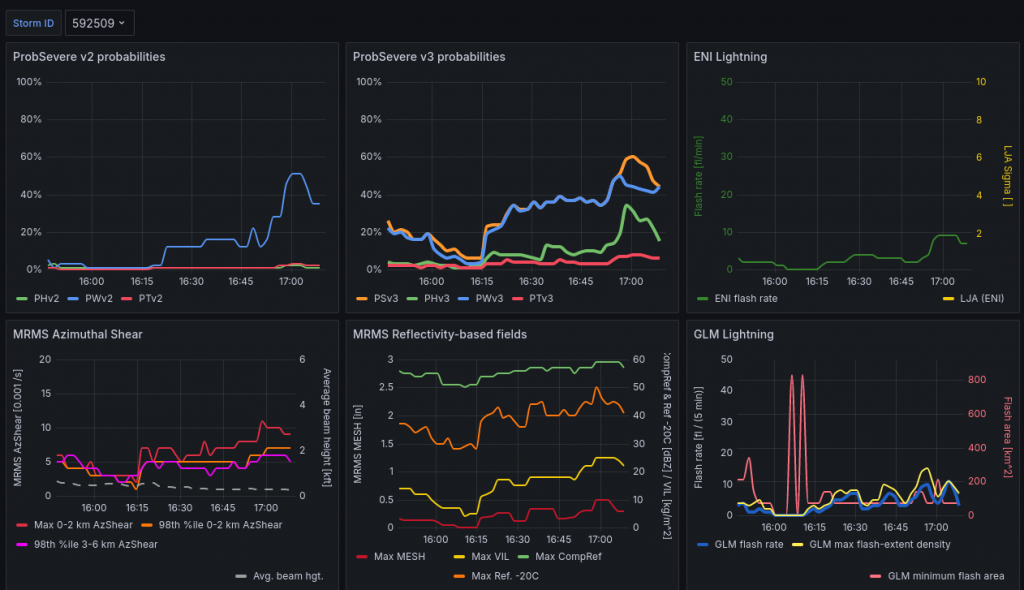
ProbSevere objects can be probed to show how probabilities are changing, and to show the different observed parameters used to diagnose the probability. Values from 1635-1710 UTC are shown below. ProbTor and ProbHail values peaked at 1700 UTC, ProbWind peaked at 1655 UTC. Both times are after the tornado.
Note in the readouts above the clickable icon that references Object ID# 592509. That click yields a time series of various ProbSevere variables and components that are shown below (there are 4 more shown here). ProbSevere for this object increased at around 1615 UTC, but values are not large. GLM values — in the lower right — showed an increase as the tornado was occurring. This was a very difficult tornado to predict based on the ProbSevere values.
GOES-16 Day Cloud Phase Distinction RGB imagery is overlain with GLM Flash Extent Density in an animation from 1640-1700. Note that the default AWIPS enhancement for FED has been altered considerably: the maximum value was changed from 260 to 20. FED increases to a peak of 15 at 1655 and 1656 UTC, having risen from 7 at 1649 UTC, the time of the tornado, before falling back to 6 by 1700 UTC. This subtle change is apparent because the default AWIPS enhancement for Flash Extent Density was altered.
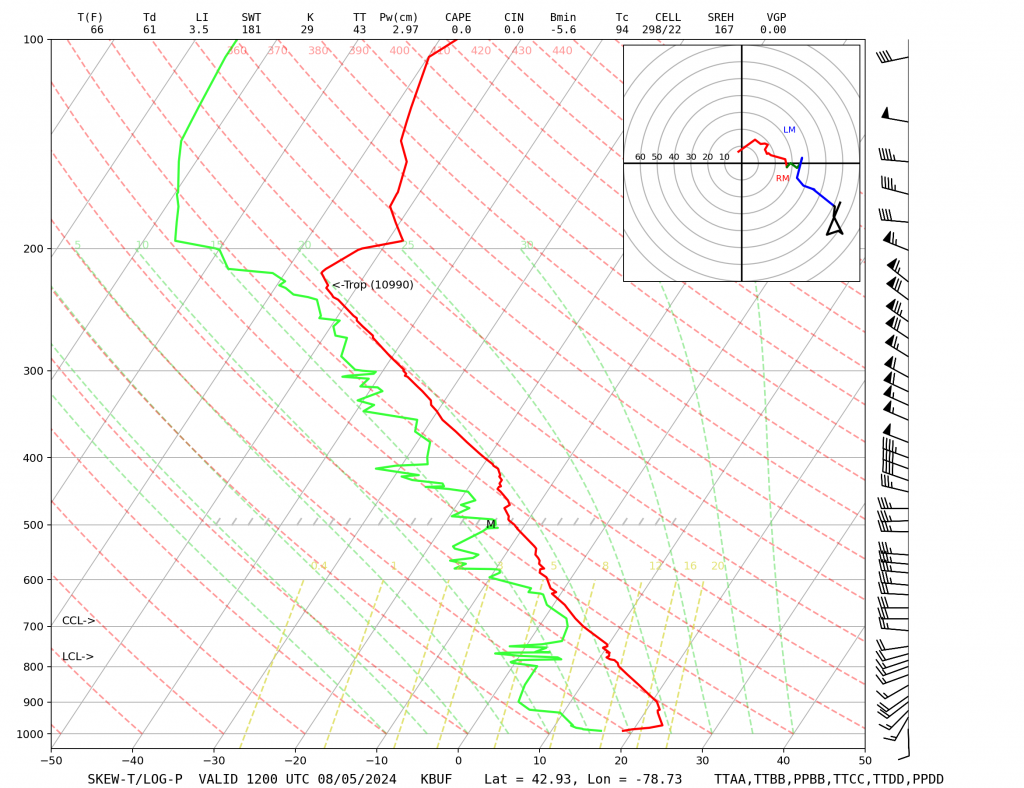
The 1200 UTC Buffalo upper air soundings is shown above. Low-level shear is favorable. This tornado appears to have emerged out of a Lake-influenced circulation within broad convergence and its very small scale nature makes its affect on satellite imagery a distinct challenge to interpret.
Added: It’s curious that this event occurred on the same day as the packet of gravity waves that developed over Michigan hours earlier (blog post). I tried very hard to see if there was a direct link between that event and this one. I didn’t find one.
—————
Free Secure Email – Transcom Sigma
Transcom Hosting
Transcom Premium Domains