
Flooding Rains on Oahu
A 16-hour animation using 5-minute GOES-18 PACUS imagery, above (saved from the Geosphere site) shows persistent convection along the east coast of Oahu on 13 May. MIMIC estimates of Total Precipitable Water on 13 May, below, show the state of Hawai’i surounded by abundant moisture, although the richest moisture within the ITCZ remains south of the state. Radar estimates of rainfall exceeded 8 inches over a large part of Oahu.
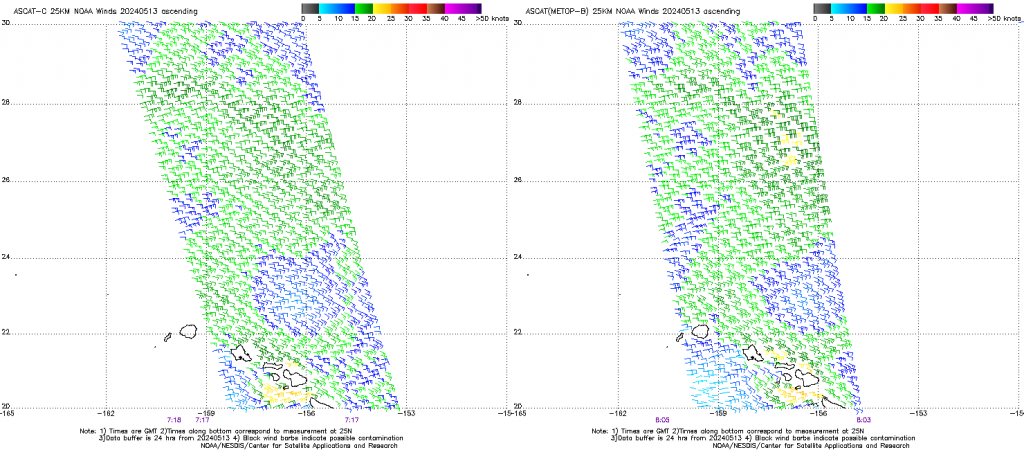
ASCAT winds before the rain developed, below, show persistent east-southeast winds.
Upper-air soundings from Lihue and Hilo at 1200 UTC on 13 May and 0000 UTC 14 May, below, (source) show deep moist layers and little in the way of a trade-wind inversion.
Flooding on the 13th resulted perhaps from persistent, steady moisture-laden flow encoutering the topography of Oahu. Even as the rain fell on the 13th, the National Weather Service in Honolulu started messaging about the possibility of heavy rains with Major Impacts on 16 May.
On 16 May, the development of a strong low to the north of Hawai’i resulted in the northward motion of moisture-rich air. This is shown in the 24-hour animation of MIMIC TPW shown below that shows both the cyclonic system developing, and the draw of moisture from the south. Unlike the case on 13 May, a case might be made on the 16th for a moisture source from the ITCZ.
GOES-18 estimates of clear-sky total precipitable water (TPW), below, from 0000 UTC 15 May to 1200 UTC 16 May, also show the gradual increase in moisture and convection over Oahu and Kauai as the circulation of the Kona low to the north of Hawai’i draws moisture northward. Convection associated with the storm on the 15th testifies to the strength of this system. The threat matrix issued late on 15 May is here. The potential for flooding on Hawai’i, particularly on Oahu and Kauai is present on 16 May, and residents of the state should be alert and aware.
The direct broadcast site at Hawaii Community College (link) included fields of Rain Rate created from NOAA-20 and Suomi-NPP ATMS data. An image from 13 May, below, shows very little precipitation detected over Oahu, testimony perhaps to the very small scale of the rains occurring on that day.
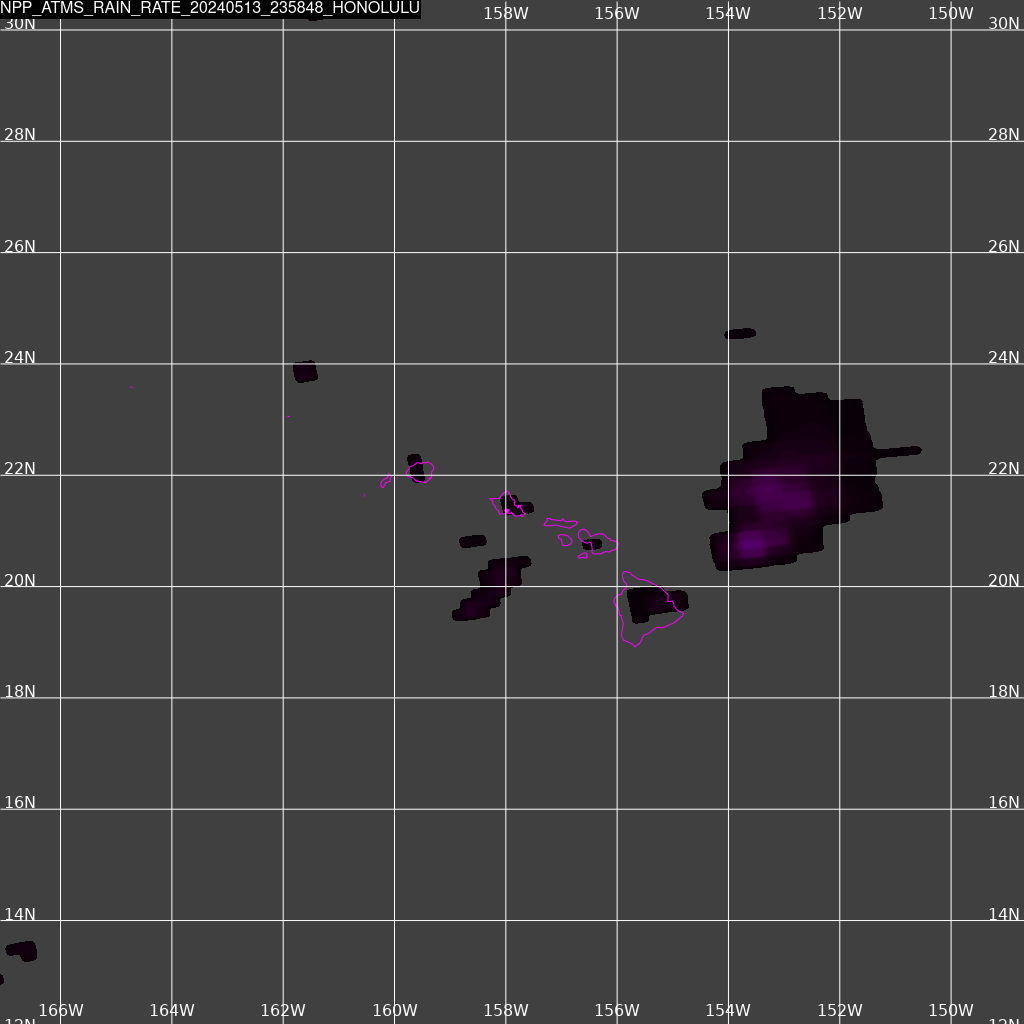
In contrast, the ATMS Rain Rates for 16 May 2024 show a large-scale feature affecting Oahu.
—————
Free Secure Email – Transcom Sigma
Transcom Hosting
Transcom Premium Domains