Deadly tornado in Middle Tennessee
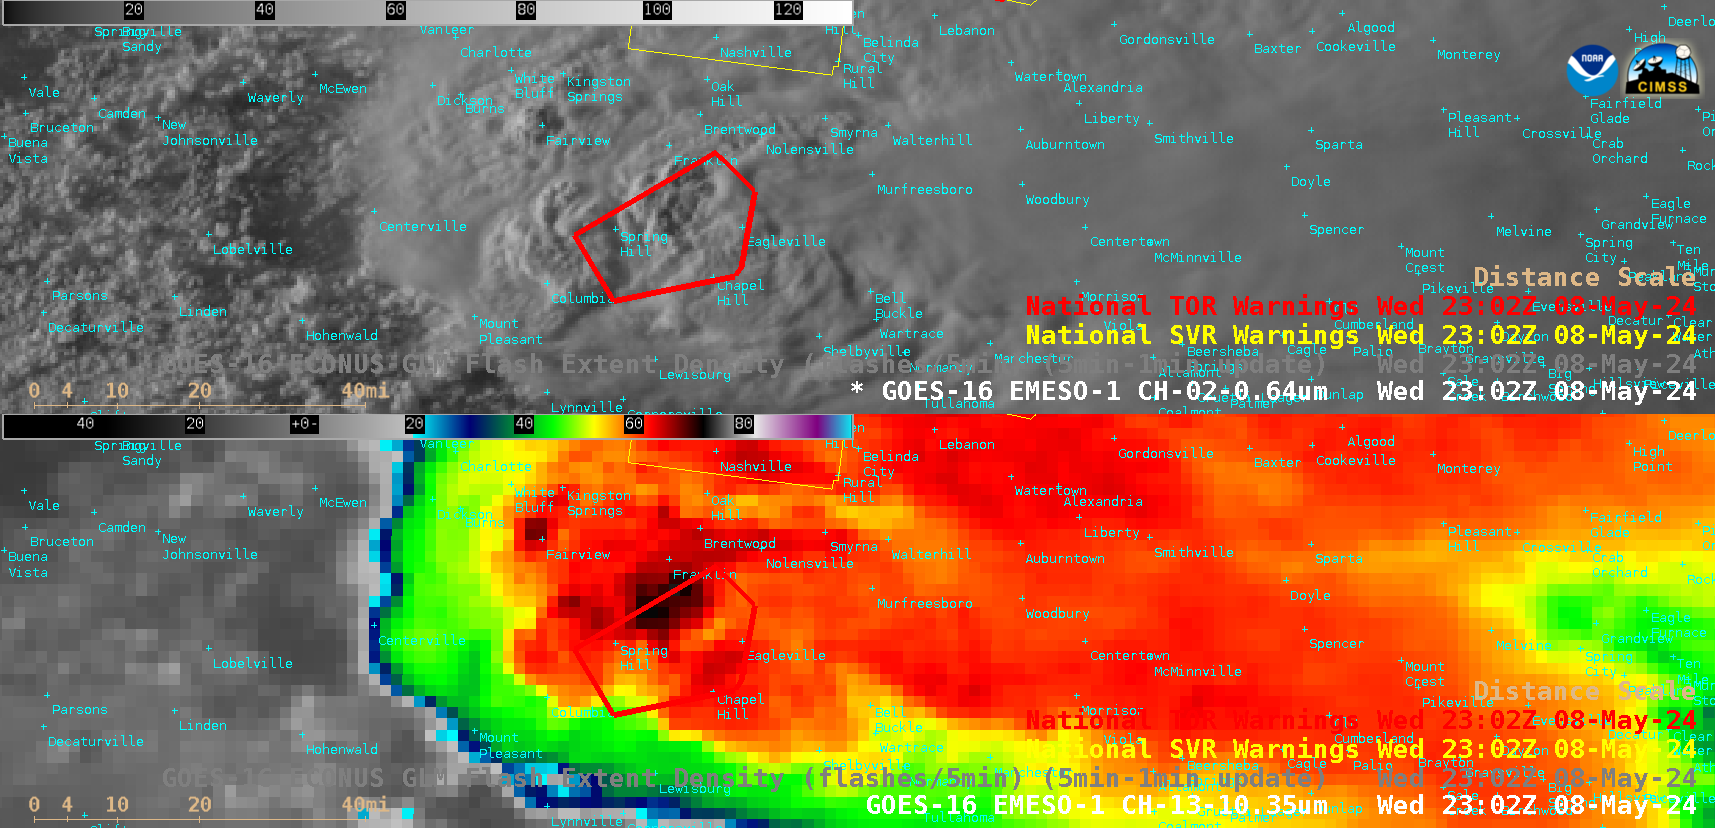
1-minute GOES-16 “Red” Visible (0.64 µm, top) and “Clean” Infrared Window (10.3 µm, bottom) images with plots of Severe Thunderstorm Warning (yellow) and Tornado Warning (red) polygons — with/without an overlay of GLM Flash Extent Density — from 2059 UTC on 08 May to 0000 UTC on 09 May [click to play animated GIF | MP4]
1-minute Mesoscale Domain Sector GOES-16 (GOES-East) “Red” Visible (0.64 µm) and “Clean” Infrared Window (10.3 µm) images (above) included plots of Severe Thunderstorm Warning and Tornado Warning polygons — which showed the supercell thunderstorm that produced EF3 damage and was responsible for 1 fatality in the Columbia / Spring Hill communities (just southwest of Nashville) on 08 May 2024 (SPC Storm Reports). Pulses of thunderstorm overshooting tops were evident in the Visible and Infrared imagery. One sequence of the images also included an overlay of GOES-16 GLM Flash Extent Density — which revealed a few brief lightning jumps (the peak Flash Extent Density rate was 172 at 2156 UTC).
1-minute GOES-16 Visible/Infrared Sandwich RGB images (below) began to exhibit an Above-Anvil Cirrus Plume or AACP (reference | VISIT training | blog posts) about an hour before the tornado began near Columbia around 2237-2244 UTC. A Tornado Emergency (bold red polygon) was then issued for the Spring Hill area (and downstream locations) at 2253 UTC.
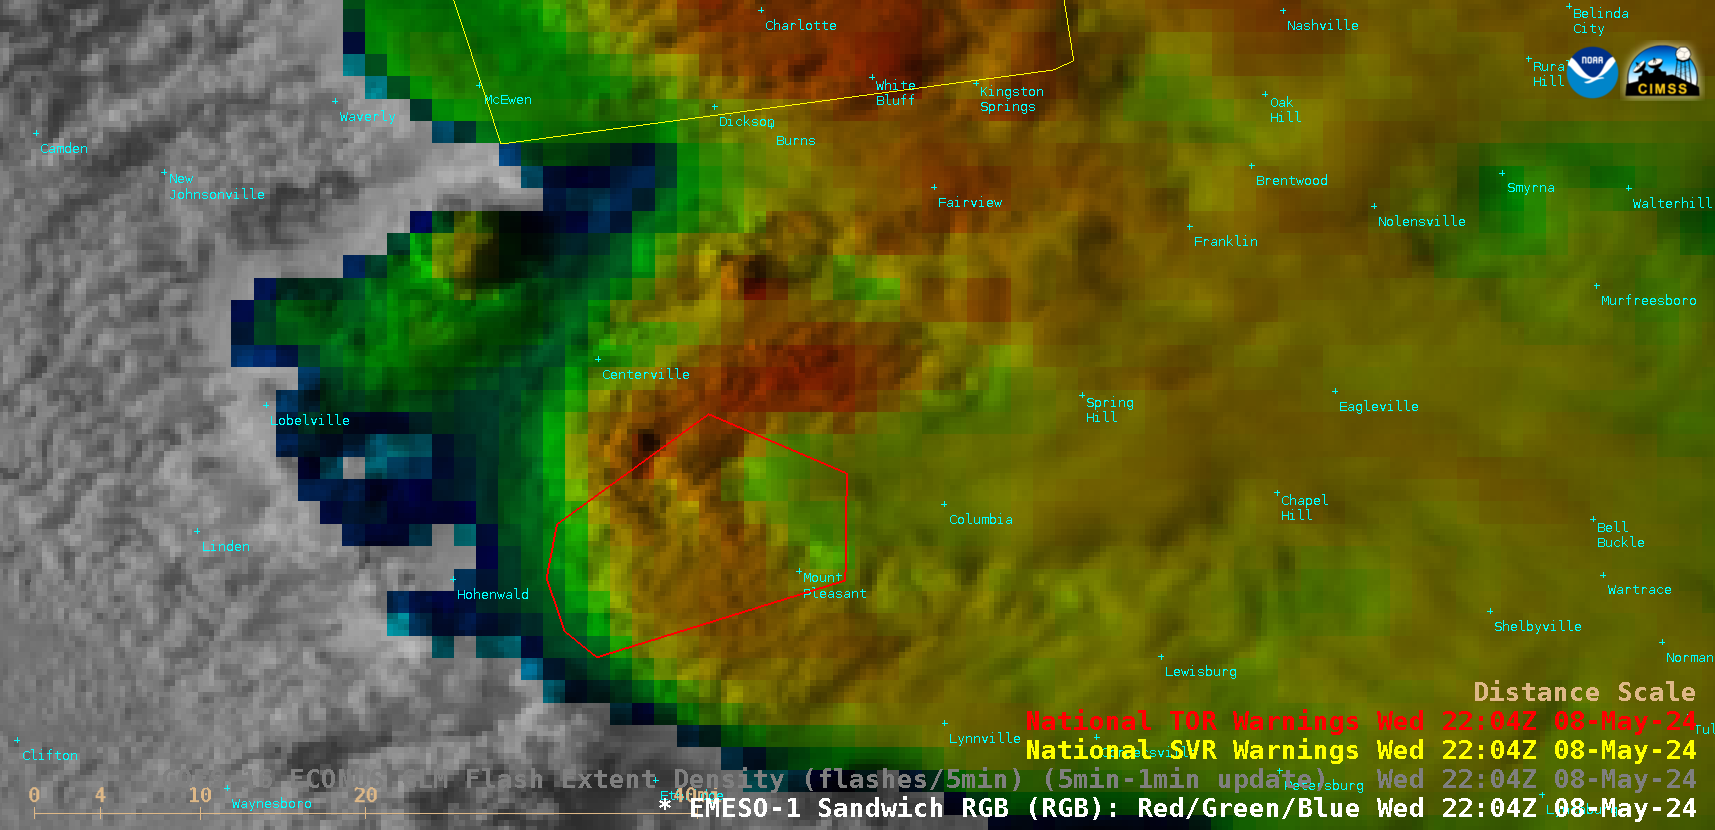
1-minute GOES-16 Visible/Infrared Sandwich RGB images with plots of Severe Thunderstorm Warning (yellow) and Tornado Warning (red) polygons, from 2059-2300 UTC on 08 May [click to play animated GIF | MP4]
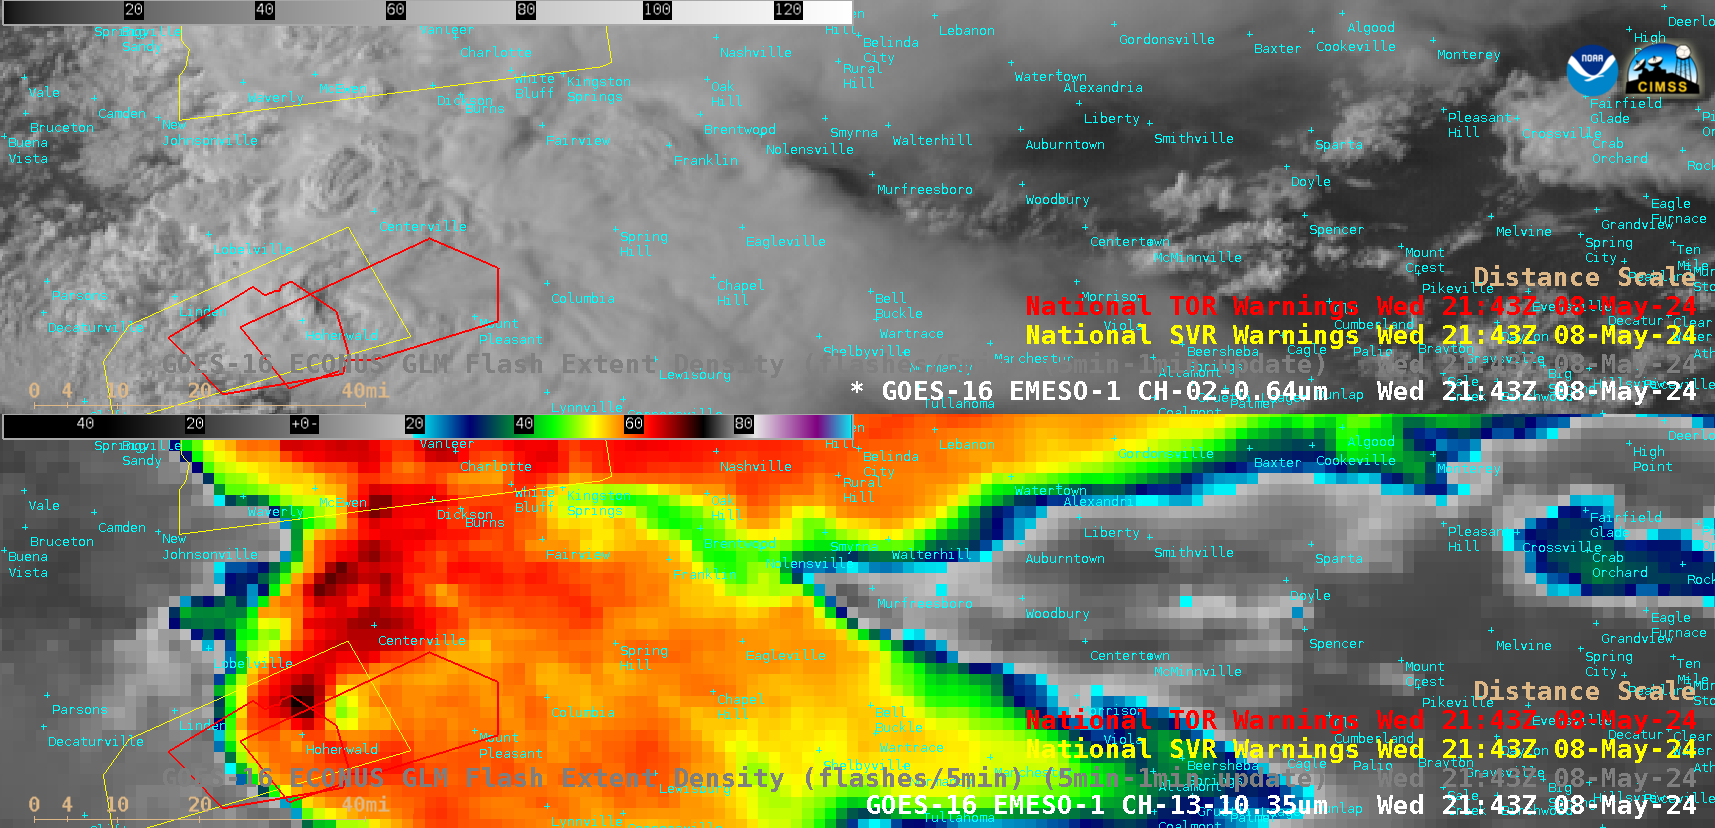
GOES-16 “Red” Visible (0.64 µm, top) and “Clean” Infrared Window (10.3 µm, bottom) images with plots of Severe Thunderstorm Warning (yellow) and Tornado Warning polygons (red) at 2143 UTC on 08 May [click to enlarge]
As the AACP was becoming well established, the cloud-top cold/warm couplet infrared brightness temperature values at 2143 UTC were -72.1ºC/-49.1ºC (darker black enhancement/brighter green enhancement), respectively (above). According to a plot (source) of rawinsonde data from Nashville, Tennessee at 1800 UTC on 08 May (below), the -72.1ºC value represented a significant (~1 km) overshoot of the Most Unstable (MU) air parcel Equilibrium Level (EL) value of -60.9ºC.
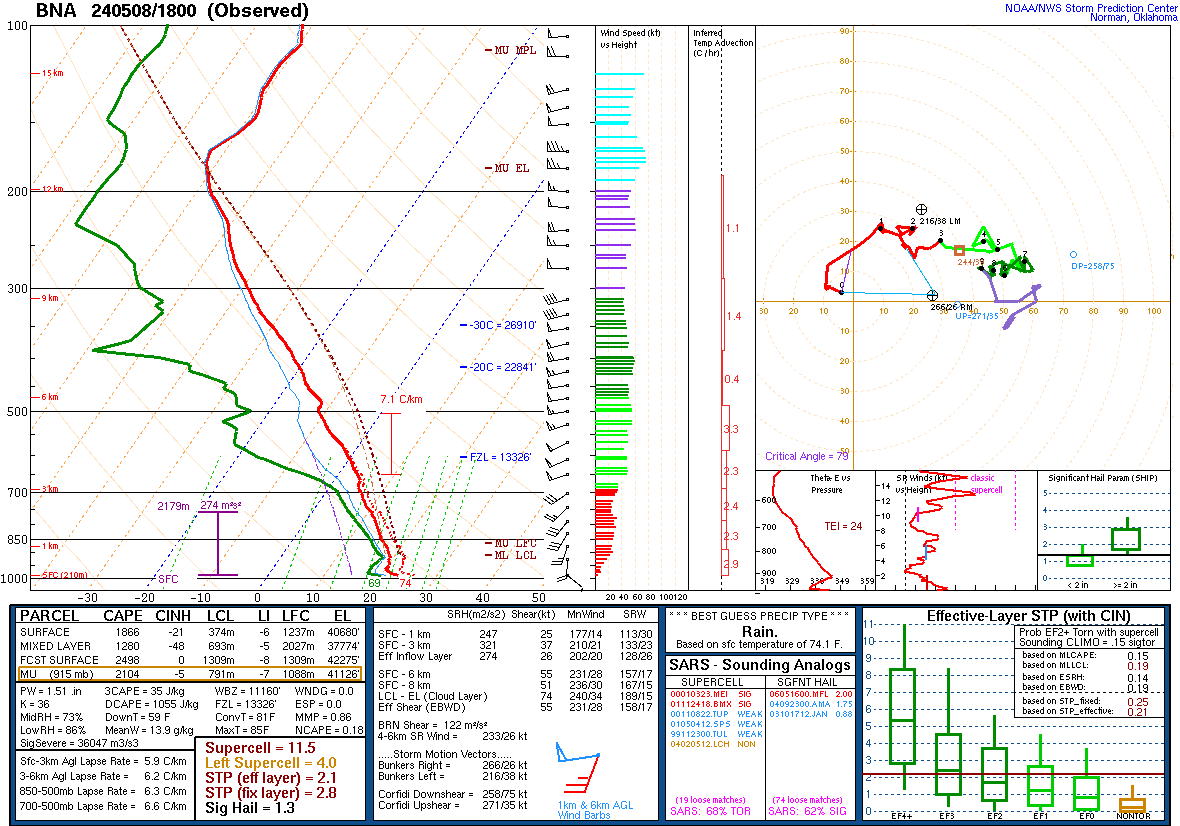
Plot of rawinsonde data from Nashville, Tennessee at 1800 UTC on 08 May [click to enlarge]
In a comparison of cursor-sampled GOES-16 “Clean” Infrared Window (10.3 µm) infrared brightness temperature along with the corresponding Cloud Top Temperature and Cloud Top Height derived products for the cloud-top cold/warm couplet at 2143 UTC (below), there was an even greater range in Cloud Top Temperature values (-75.5ºC vs -47.4ºC), at Cloud Top Height values of 44222 ft (13.5 km) and 37757 ft (11.5 km), respectively.
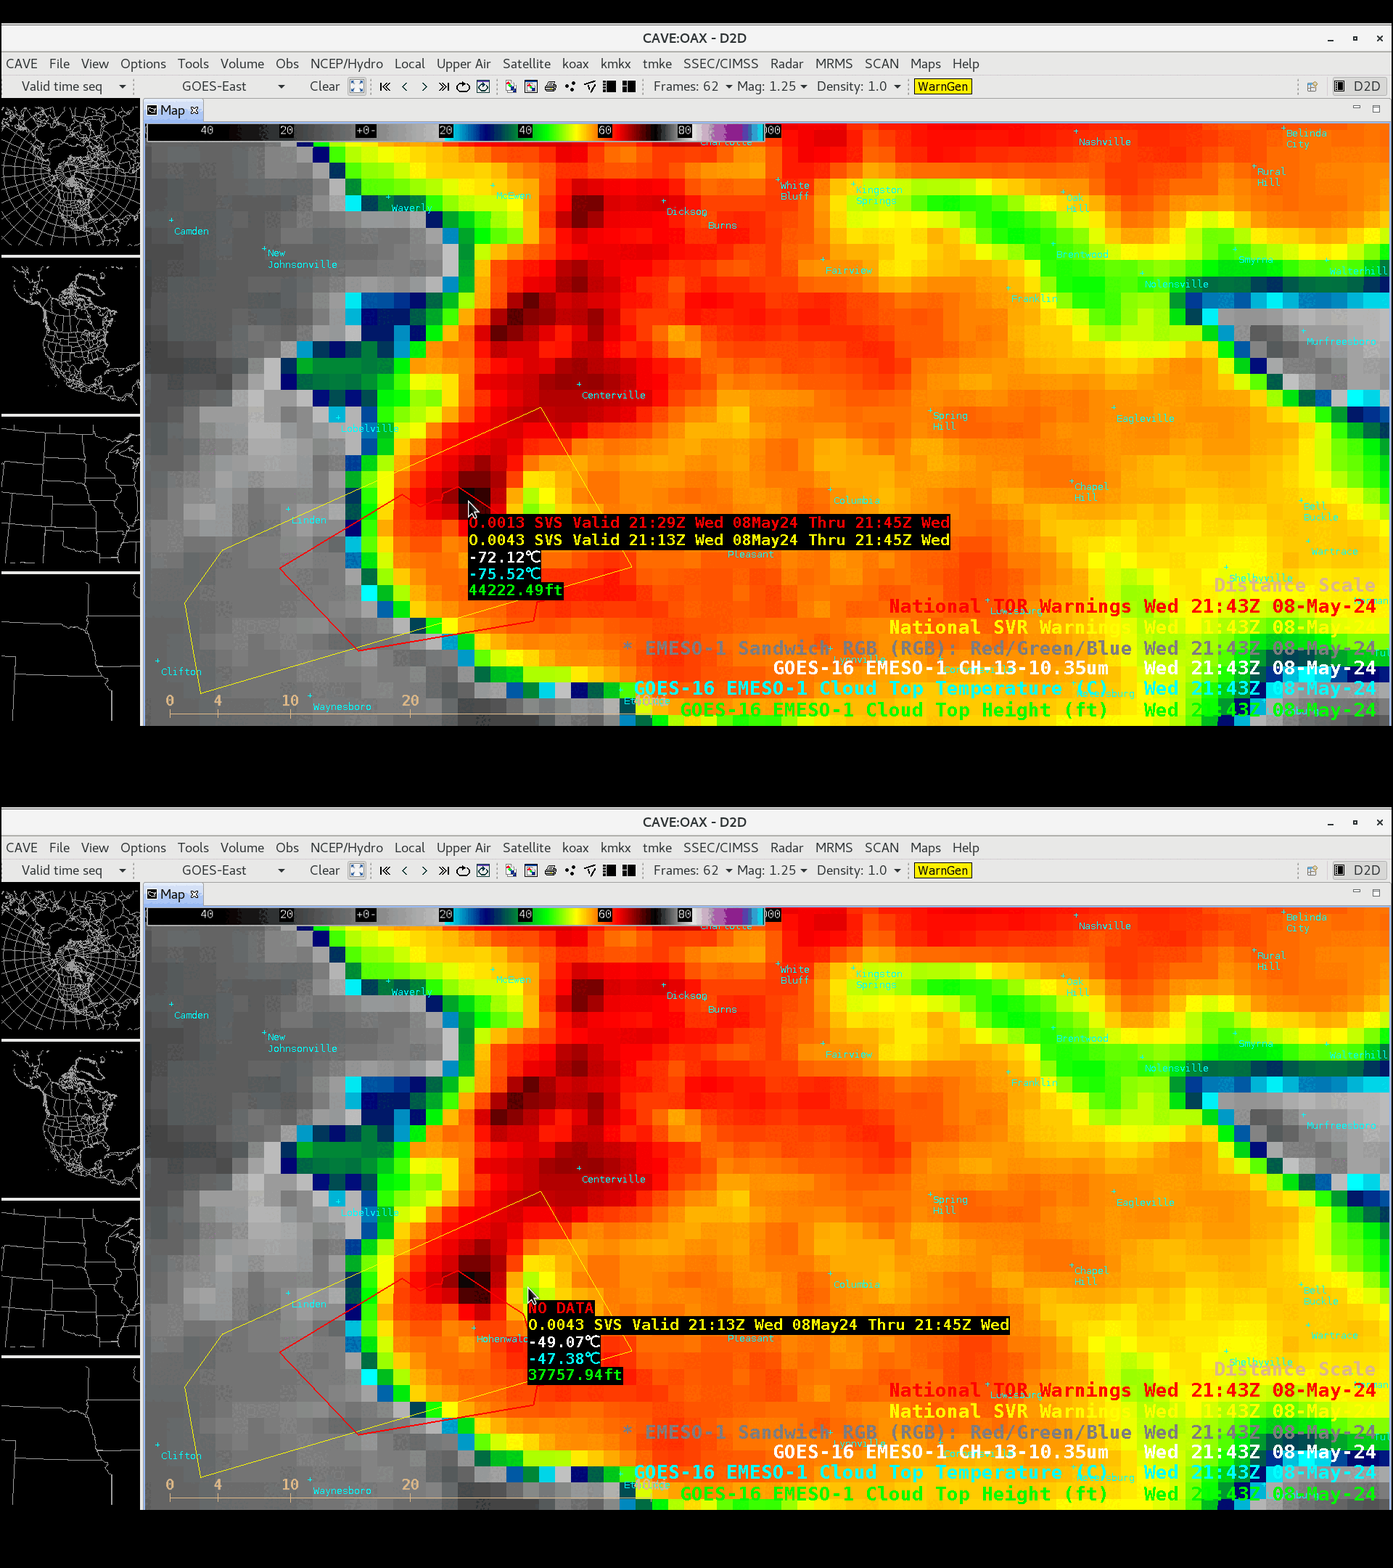
Cursor sample of GOES-16 “Clean” Infrared Window (10.3 µm) infrared brightness temperature (white) along with the Cloud Top Temperature (cyan) and Cloud Top Height (green) derived products for the cloud-top cold/warm couplet at 2143 UTC on 08 May [click to enlarge]
—————
Free Secure Email – Transcom Sigma
Transcom Hosting
Transcom Premium Domains
