Severe thunderstorms produce large hail and damaging winds in parts of North Carolina and South Carolina

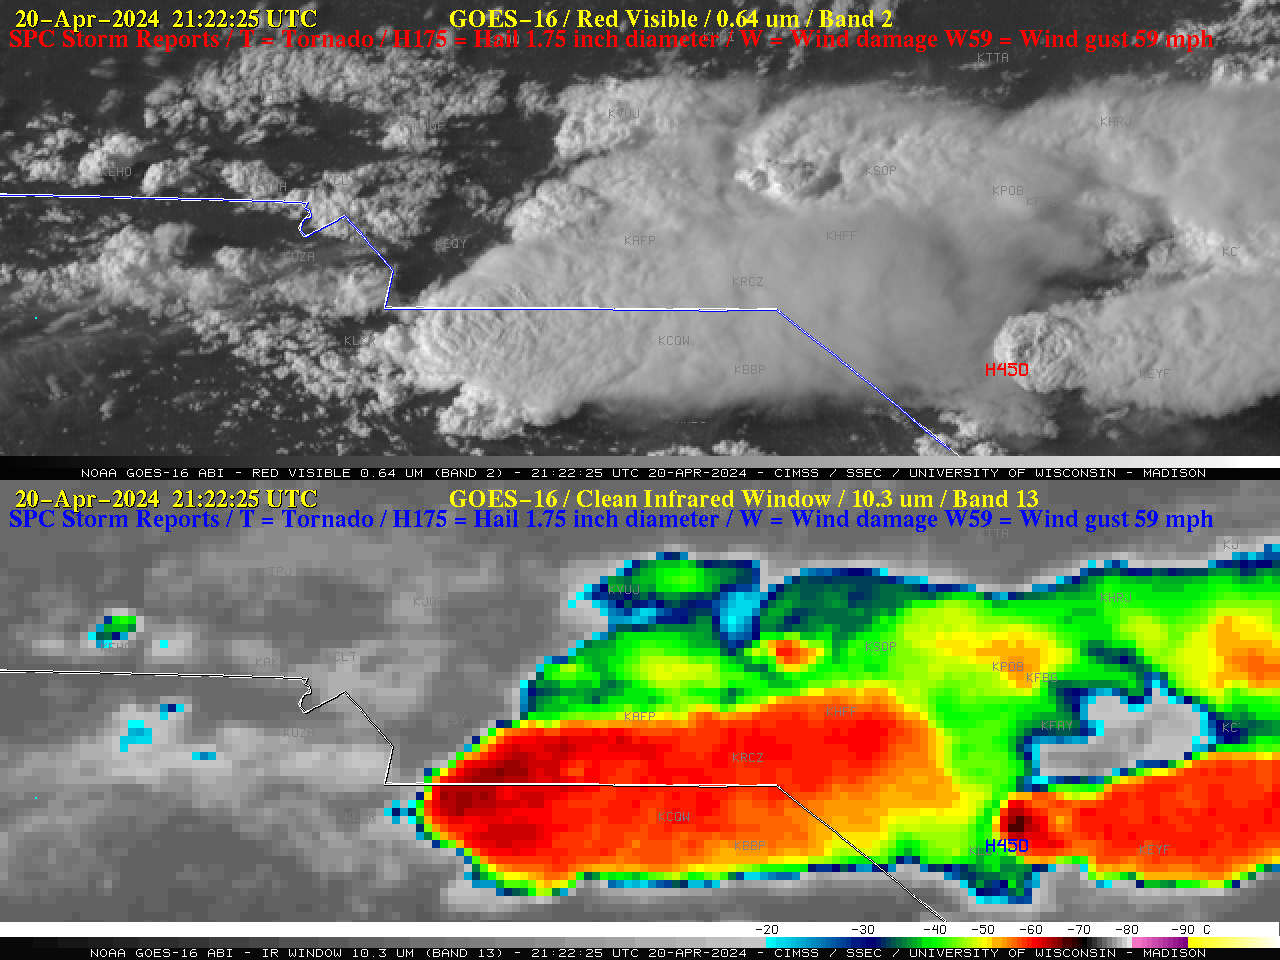
1-minute GOES-16 “Red” Visible (0.64 µm, top) and “Clean” Infrared Window (10.3 µm, bottom) images with time-matched (+/- 3 minutes) SPC Storm Report plots, from 1915 UTC to 2137 UTC on 20 April [click to play animated GIF | MP4]
1-minute Mesoscale Domain Sector GOES-16 (GOES-East) images showed clusters of severe thunderstorms that developed in the vicinity of the North Carolina / South Carolina border on 20 April 2024 — “Red” Visible (0.64 µm) and “Clean” Infrared Window (10.3 µm) images (above) included time-matched plots of preliminary/filtered SPC Storm Reports for these thunderstorms, which produced wind gusts as high as 90 mph and hail as large as 4.00 inches in South Carolina, and hail that was possibly as large as 4.50 inches in diameter in Lumberton, North Carolina (KLBT) at or around 2122 UTC (a toggle between the GOES-16 Visible and Infrared images at 2122 UTC is shown below, which portrayed a distinct overshooting top in the vicinity of that hail report). The coldest cloud-top 10.3 µm infrared brightness temperatures were around -70ºC (darker black enhancement) — according to a plot of 1200 UTC Greensboro NC rawinsonde data, that -70ºC cloud-top infrared brightness temperature represented a small overshoot of the local tropopause (which was -65.5ºC at 185 hPa or 12.5 km).

GOES-16 Visible and Infrared images at 2122 UTC [click to enlarge]

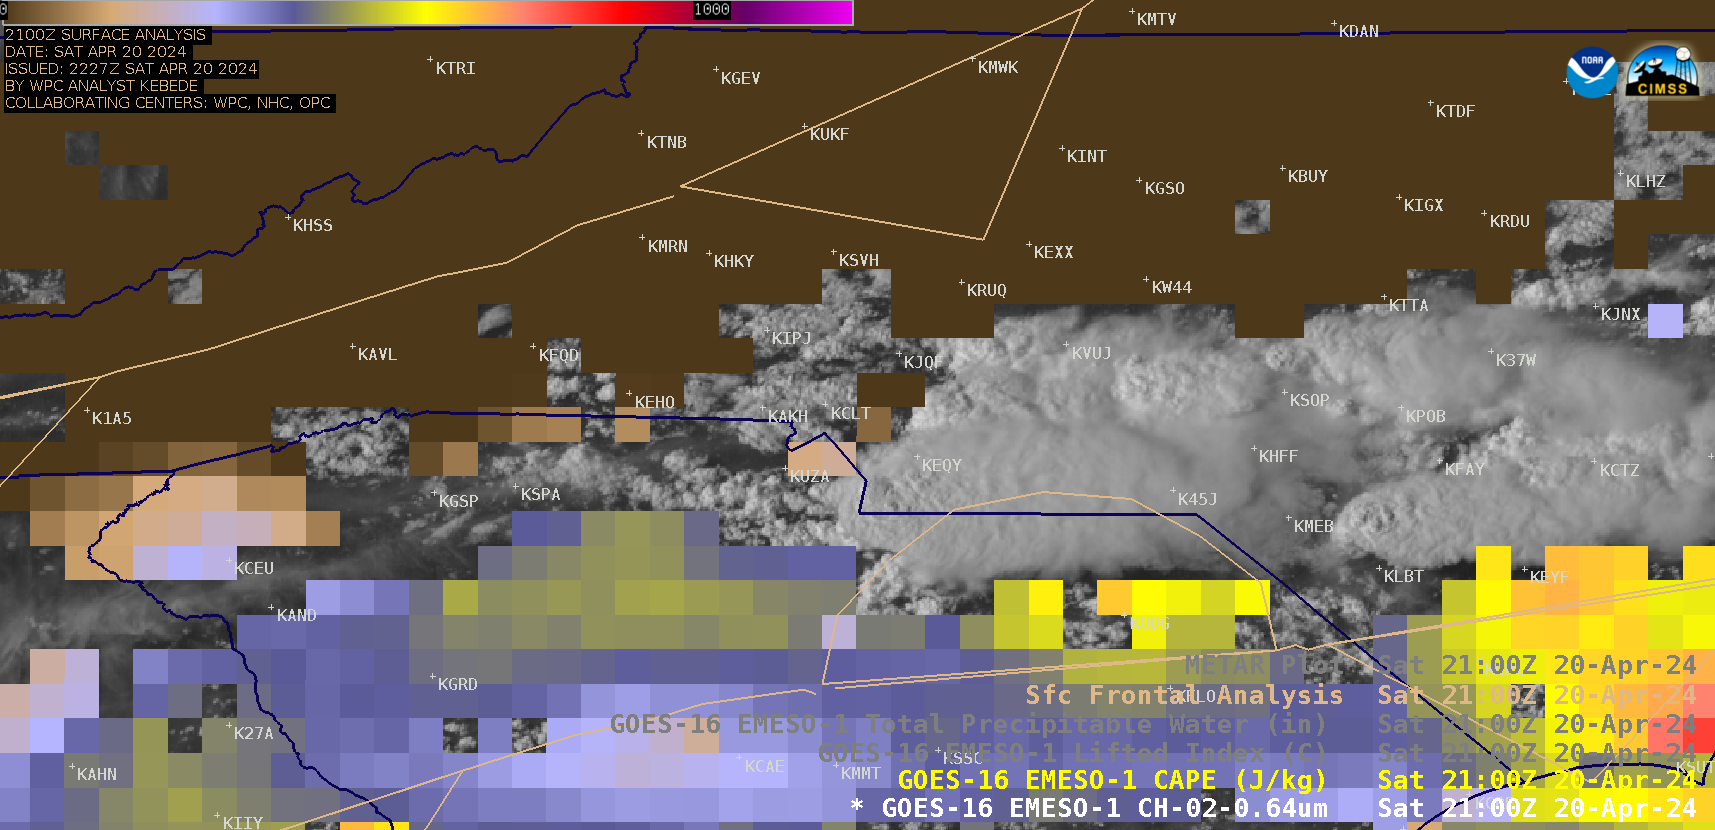
1-minute GOES-16 “Red” Visible (0.64 µm) images with an overlay of the CAPE and Lifted Index derived stability indices, from 1900-2300 UTC on 20 April [click to play animated GIF | MP4]
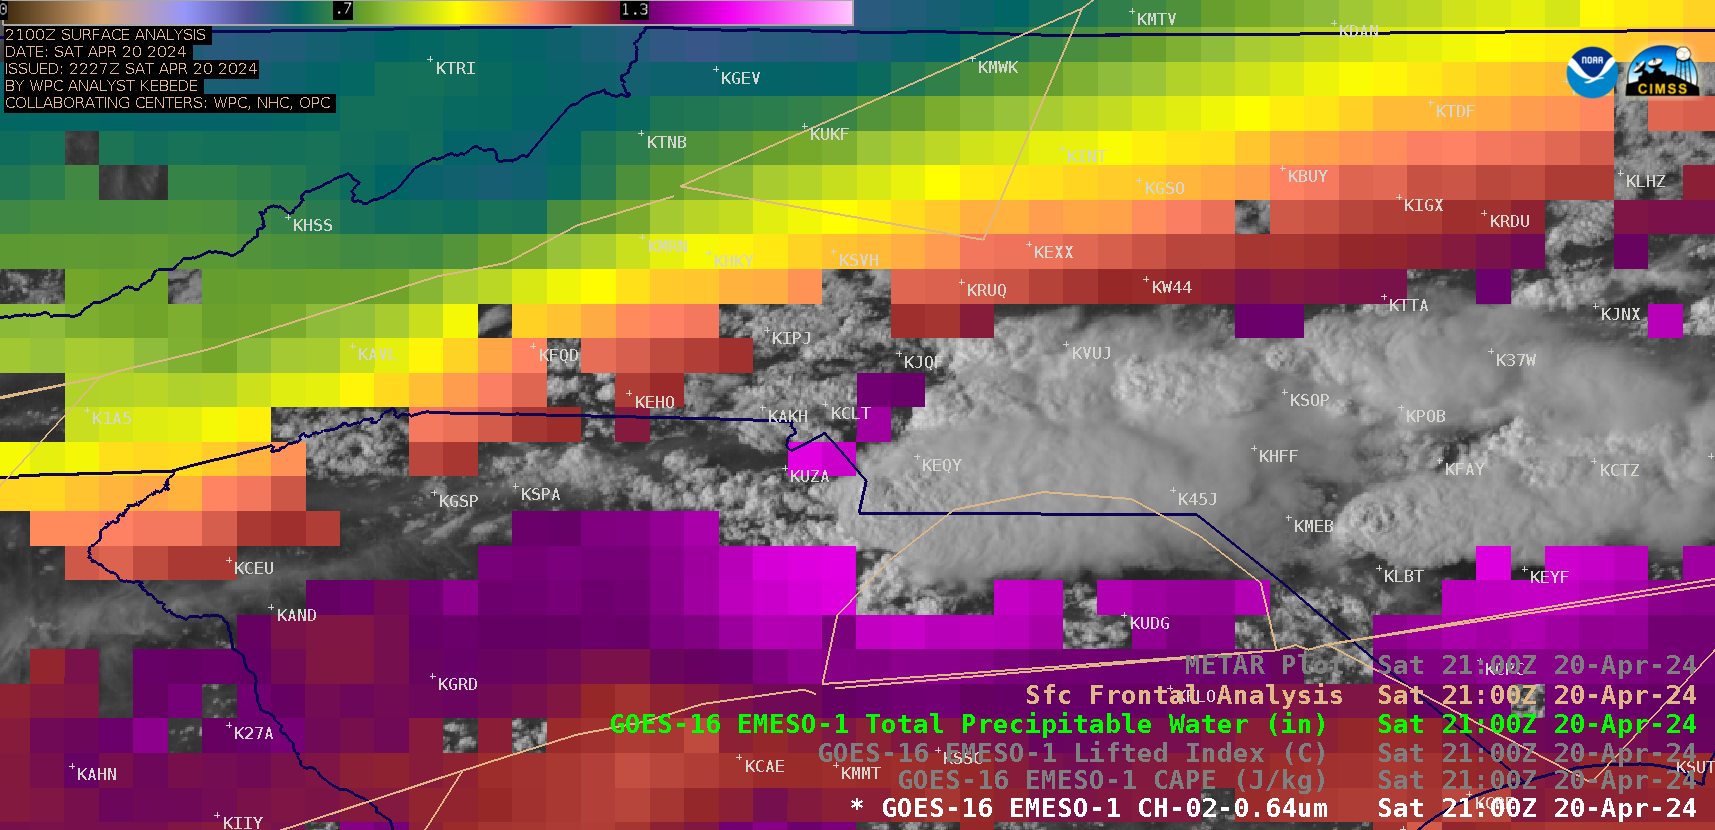
1-minute GOES-16 Visible images combined with CAPE and Lifted Index Derived Stability Indices in cloud-free skies (above) indicated that an axis of instability existed in the general vicinity of a diffuse quasi-stationary frontal boundary, which was situated south of the developing thunderstorms. However, these severe thunderstorms were developing within a corridor of enhanced moisture that was located just north of the front, as seen in GOES-16 Visible images combined with the Total Precipitable Water derived product (below).

1-minute GOES-16 “Red” Visible (0.64 µm) images with an overlay of the Total Precipitable Water derived product, from 1900-2300 UTC on 20 April [click to play animated GIF | MP4]
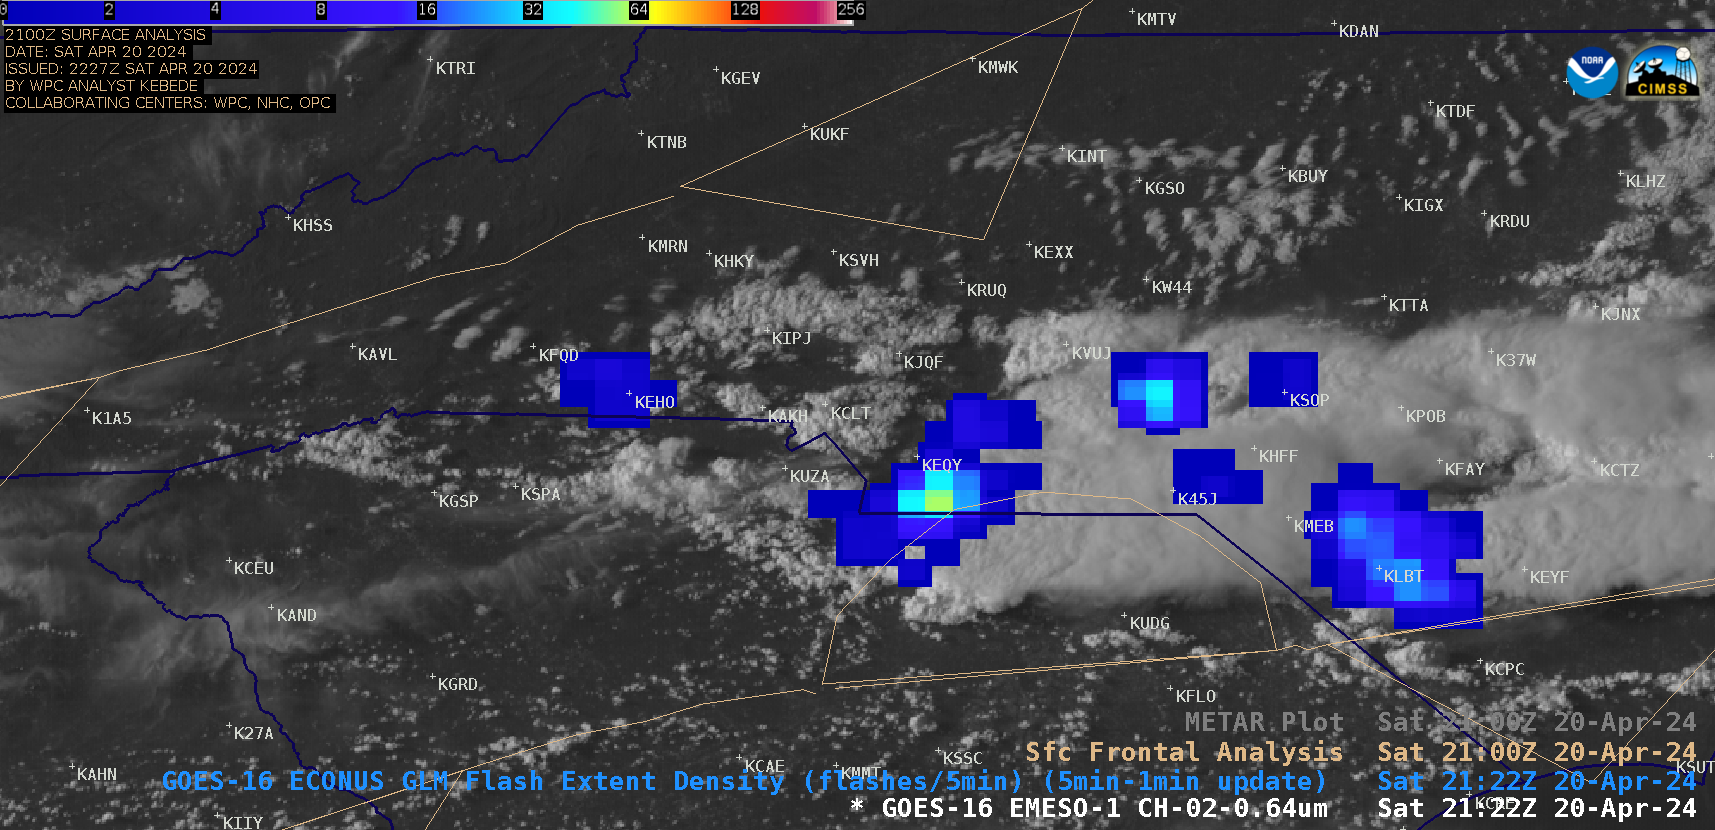
1-minute GOES-16 Visible images with/without an overlay of GLM Flash Extent Density (below) showed the lightning activity associated with these thunderstorms, which included periodic brief lightning jumps.

1-minute GOES-16 “Red” Visible (0.64 µm) images with/without an overlay of GLM Flash Extent Density, from 1820-2300 UTC on 20 April [click to play animated GIF | MP4]
—————
Free Secure Email – Transcom Sigma
Transcom Hosting
Transcom Premium Domains
