Using Level 2 Products to understand Cloud Patterns
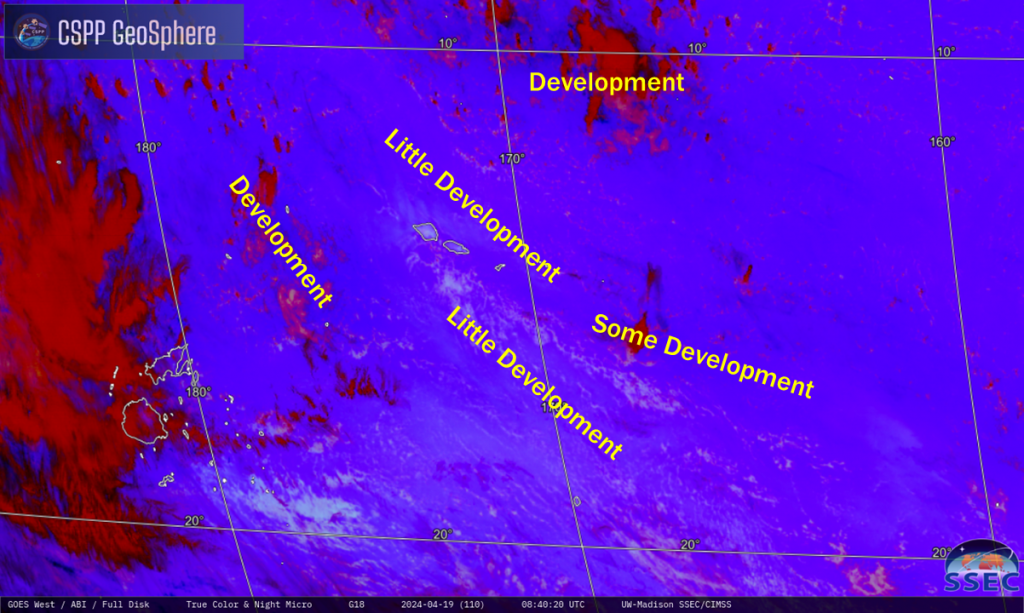
The animation below from the CSPP Geosphere website (direct link to animation) shows regions of low clouds, some of which develop in the vertical, and some of which do not (see annotated image underneath the animation). Is there a product that can be used to discriminate between these two regions?

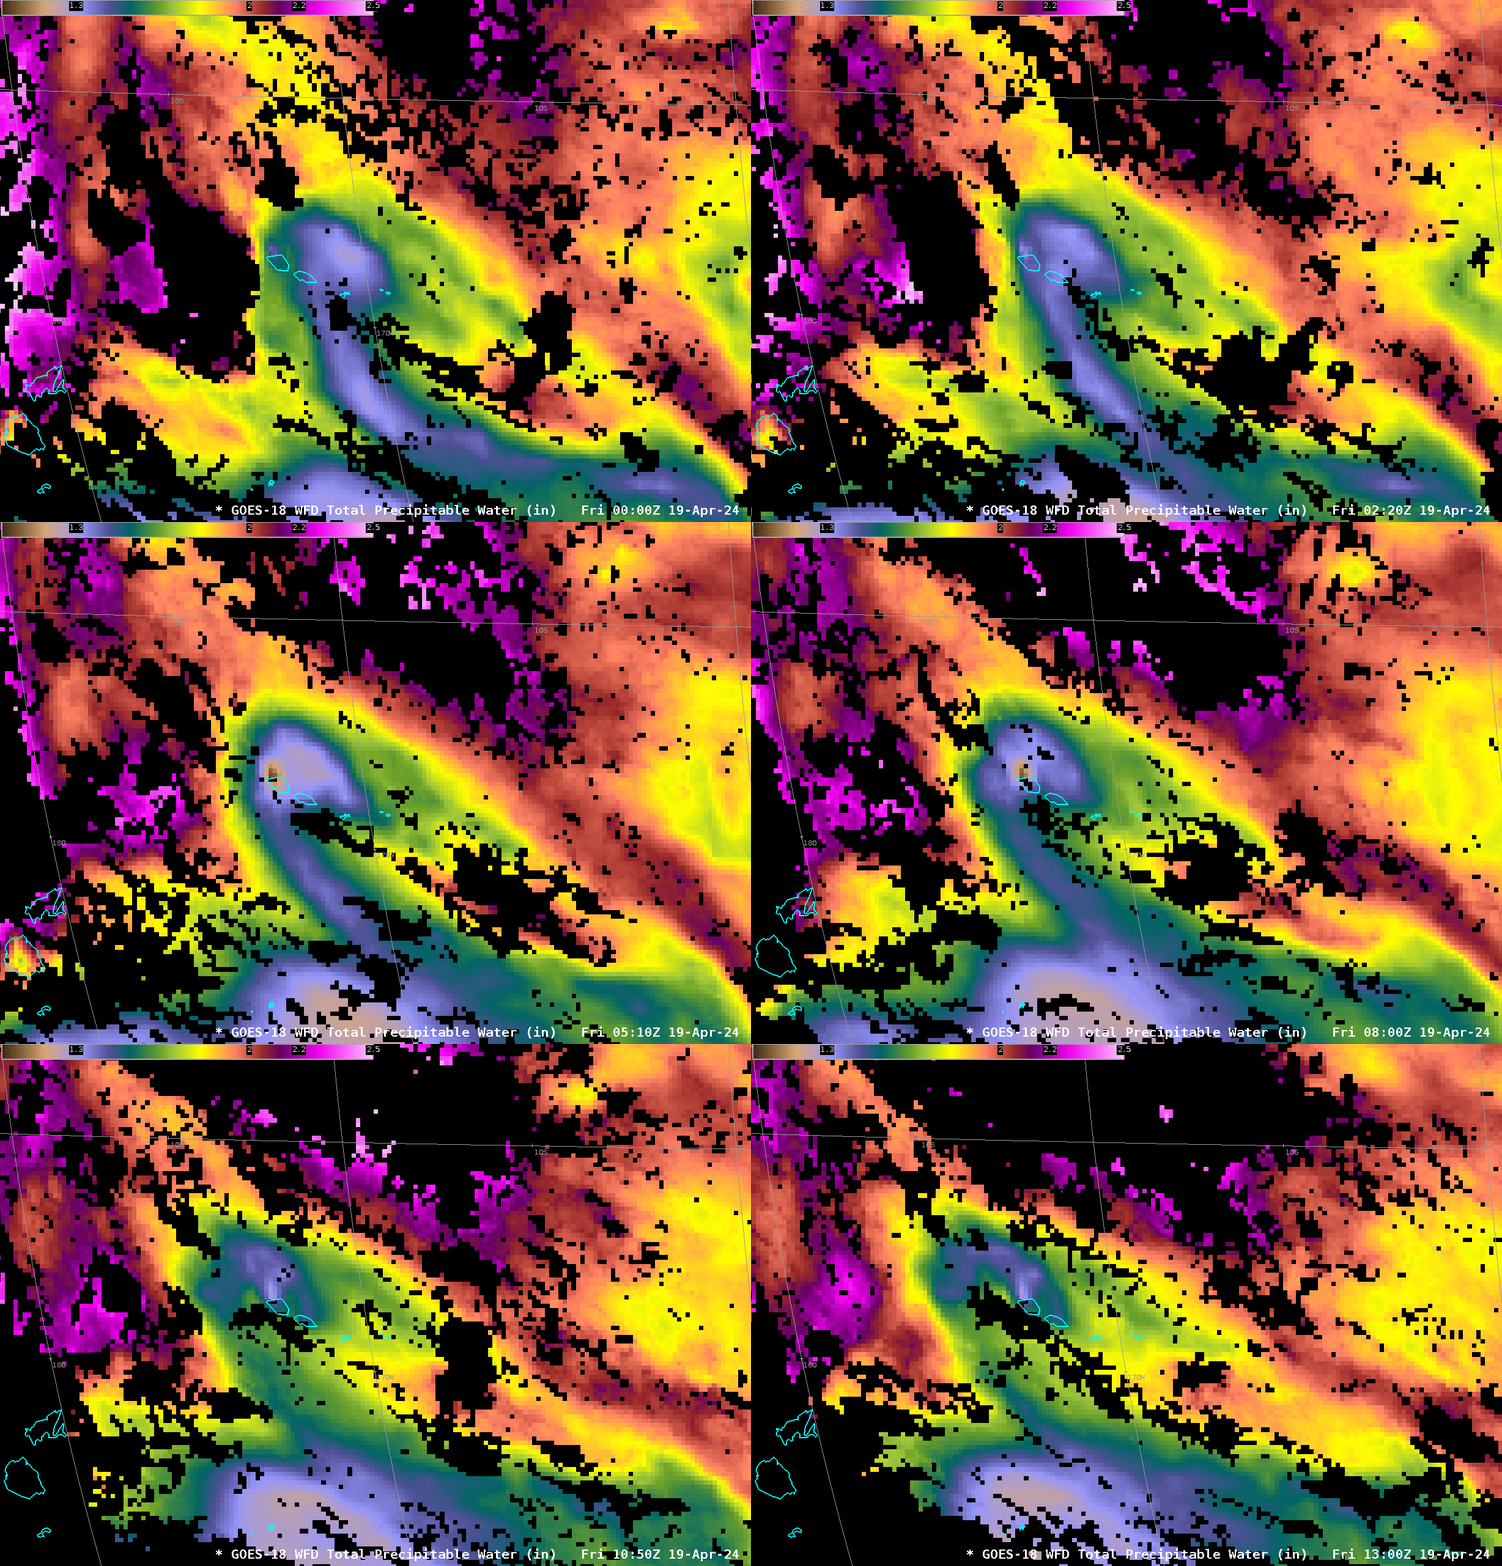
GOES-18 Total Precipitable Water fields, below, might help you understand why development occurs in some places (where there’s more moisture) and doesn’t occur in others (where there’s not quite so much moisture). In the color enhancement below, blue/green regions are relatively dry — 1.4 to 1.6 inches of TPW — and yellow and orange regions are not as dry: 1.8 to 2.0″ of TPW. Total Precipitable Water is a clear-sky product; high clouds that are masking the fields are generally moving south to north, and low clouds (including those that occasionally develop in the vertical) are moving towards the northwest. The low clouds are mostly static (as far as vertical growth is concerned) in regions that are diagnosed as dryer in the TPW fields.

Use Level 2 Products from GOES-R to better understand and anticipate how the atmosphere will evolve in the near term.
—————
Free Secure Email – Transcom Sigma
Transcom Hosting
Transcom Premium Domains
