
Unusually dry air aloft across Florida
GOES-16 Mid-level (6.9 µm) and Upper-level (6.2 µm) Water Vapor images (with/without a map overlay), from 1201 UTC on 05 April to 0001 UTC on 06 April; rawinsonde sites are plotted in red [click to play animated GIF | MP4]
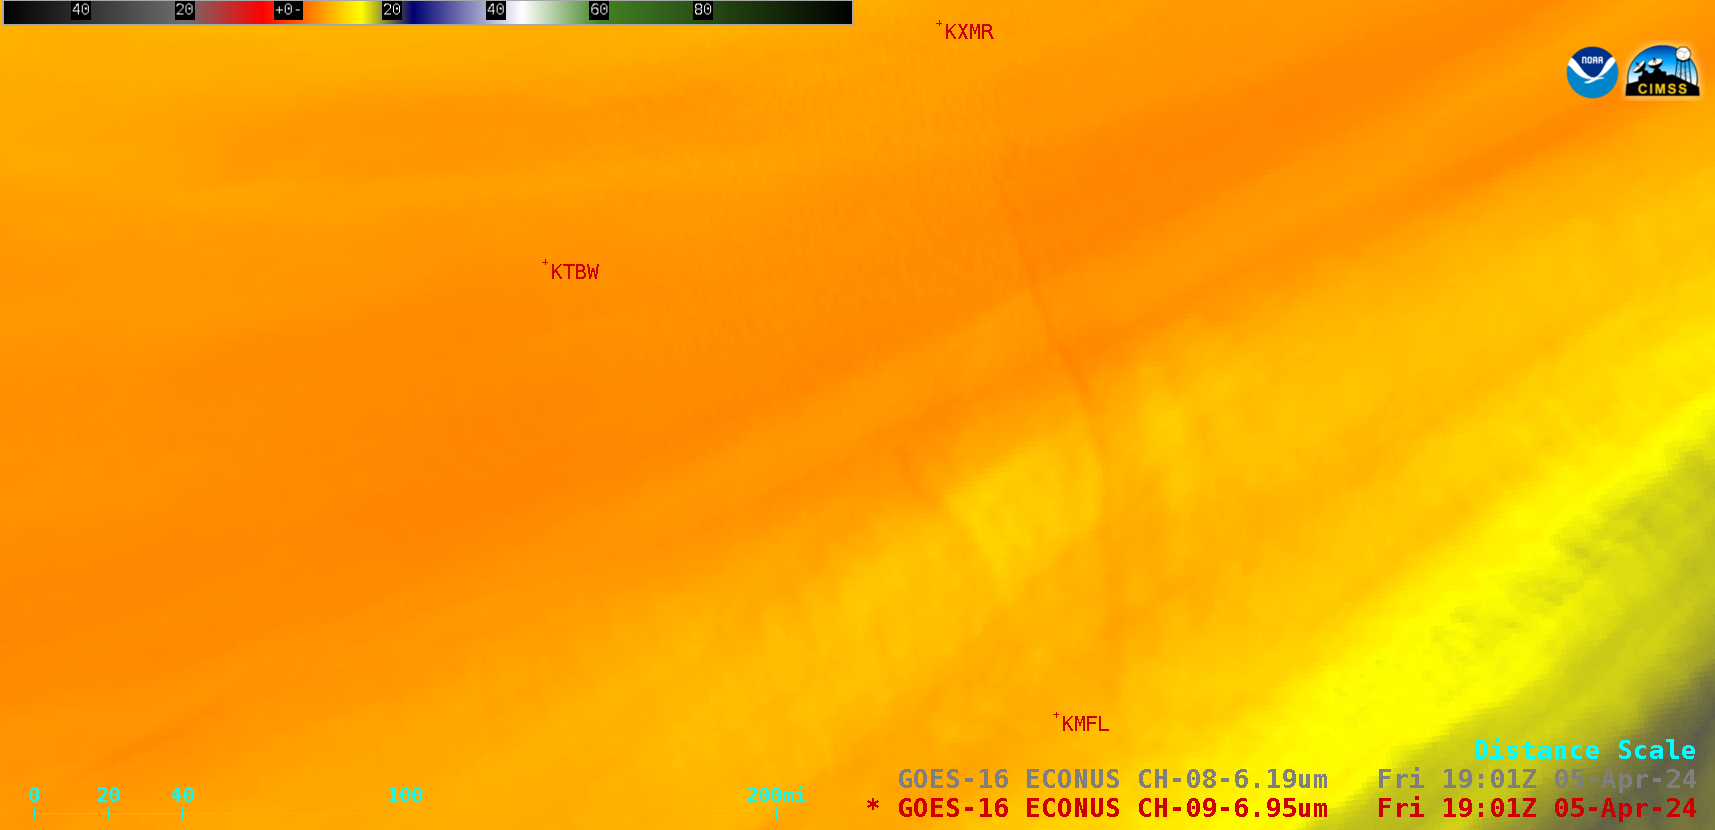
5-minute CONUS Sector GOES-16 (GOES-East) Mid-level Water Vapor (6.9 µm) and Upper-level Water Vapor (6.2 µm) images (above) revealed that the outline of a portion of Florida’s east coast (specifically along the Gold Coast and the Emerald Coast) could briefly be seen during the day on 05 April 2024. 1901 UTC Water Vapor images with/without a map overlay are shown below. The outline of Florida has been evident in Water Vapor imagery in the past, but usually during the much colder and drier winter months (for example, February 2019).
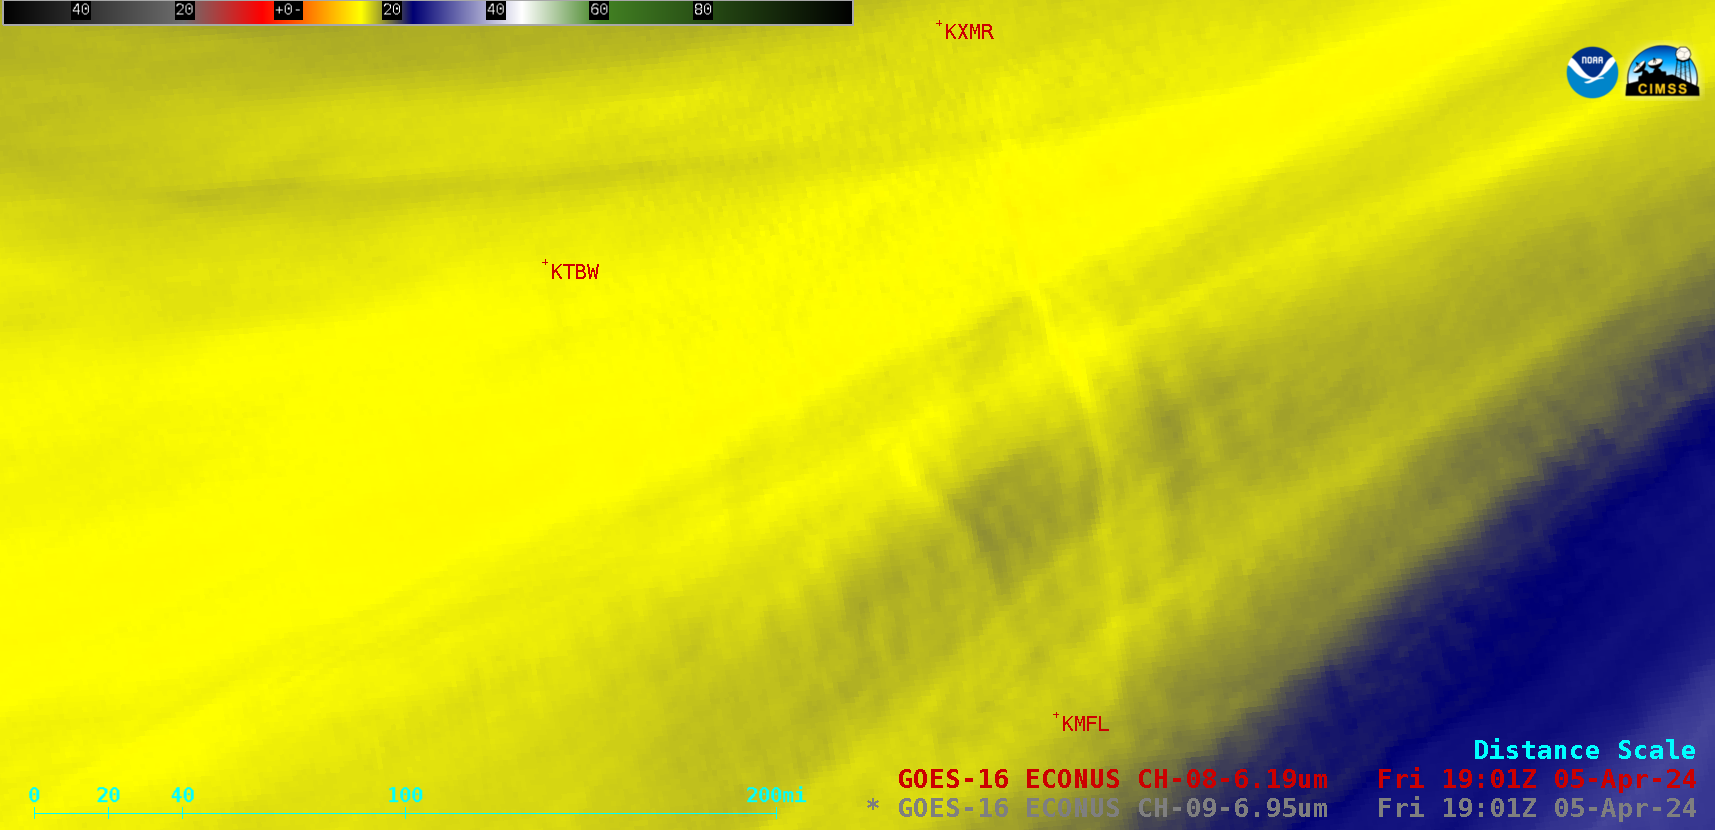
GOES-16 Mid-level (6.9 µm) and Upper-level (6.2 µm) Water Vapor images (with/without a map overlay) at 1901 UTC on 05 April; rawinsonde sites are plotted in red [click to play animated GIF | MP4]
Plot of rawinsonde data from Tampa Bay, Florida at 1200 UTC on 05 April [click to enlarge]
Along the west coast of Florida that morning at Tampa Bay, 1200 UTC rawinsonde data (above) depicted a Total Precipitable Water value of 0.44 in; while that TPW values was unusually low for Tampa Bay, their sounding climatology (below) indicated it was above the record low 12 UTC / 05 April value of 0.20 in.
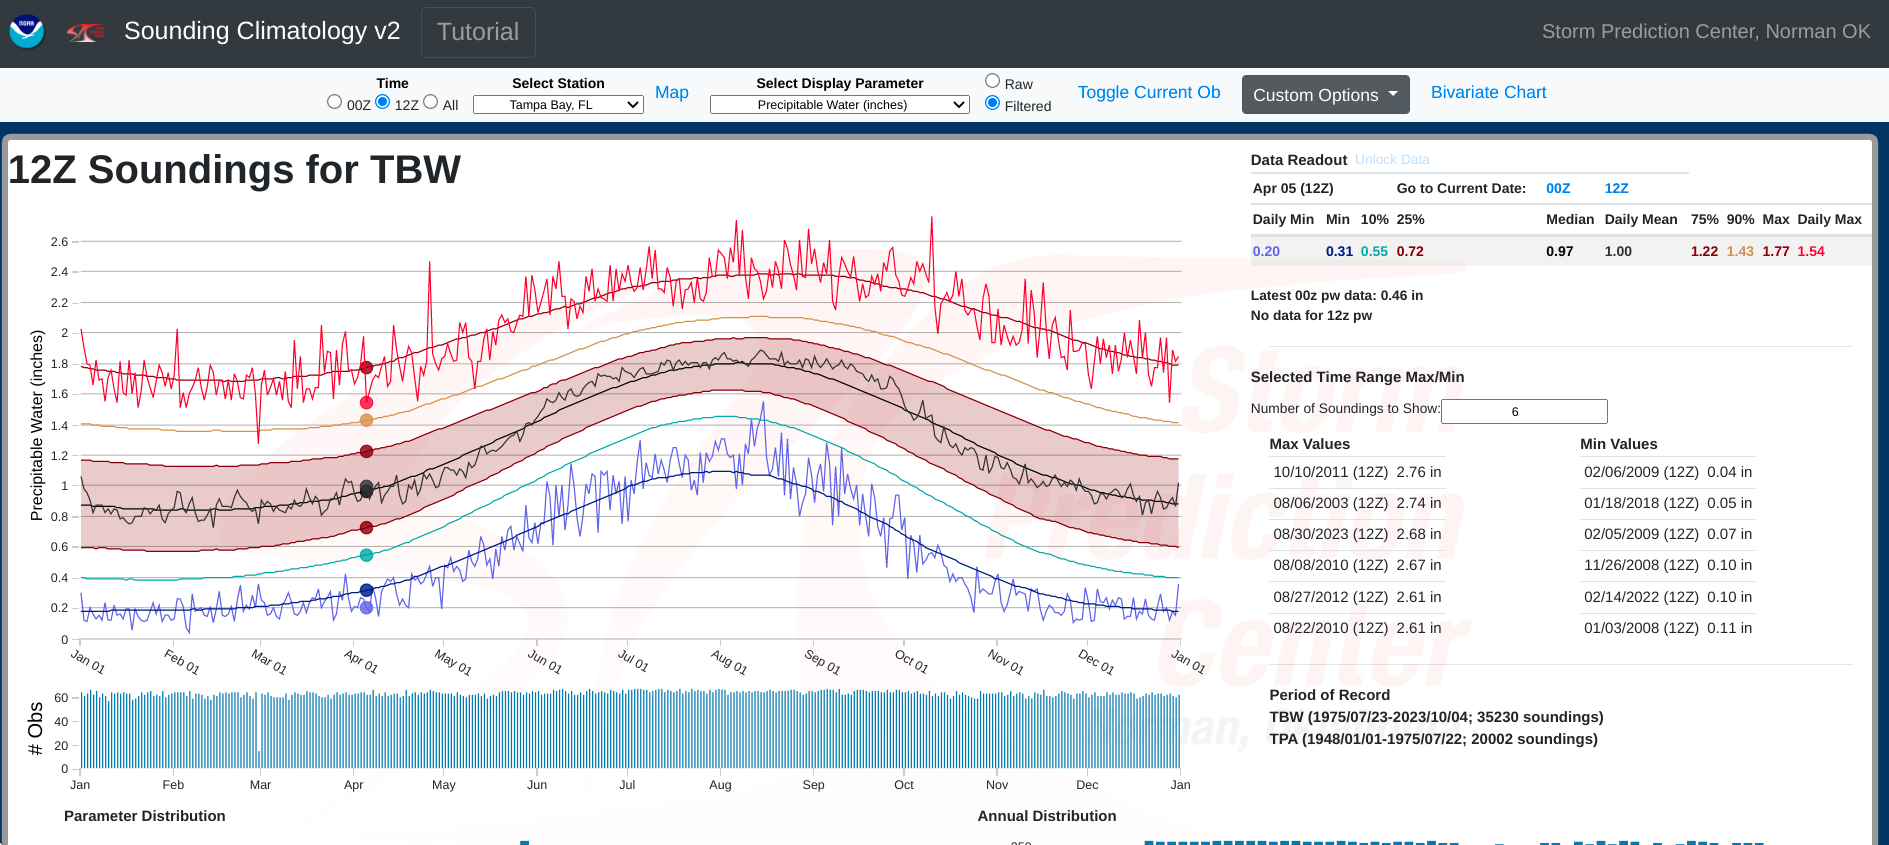
Climatology of Total Precipitable Water for all 1200 UTC soundings on 05 April at Tampa Bay [click to enlarge]
—————
Free Secure Email – Transcom Sigma
Transcom Hosting
Transcom Premium Domains