Cloud band hugging the shore of Lake Michigan
The animation above shows true-color imagery from the CSPP Geosphere site (direct link to animation). Of particular interest is the cloud band that forms along the western shore of Lake Michigan, especially near Chicago, and north of Milwaukee. The toggle below of the True Color imagery and Cloud Top Height suggests the cloud tops are at or above 700 mb (see this 1951 UTC image of Cloud Top Height), perhaps too high to be affected by the Lake Michigan. A curious feature (at least to me) of this animation is that the cloud band does not appear underneath the high clouds over southeast Wisconsin. Does that mean that solar forcing plays some role in this band’s development?

This event was brought to our attention by Gino Izzi at WFO LOT (i.e., Chicago) via this email that concludes:
visible imagery starting just before 18z this standing wave looking mid level cloudiness formed on the southwestern shores of Lake Michigan. Eventually some subtle waves form just a hair downstream over the lake and the standing wave seems to propagate upwind just a bit. These wave clouds appear to be around 10kft (~700mb) and looking at ACARS soundings this is at the top of a deep isothermal layer based at around 850mb. The strength of the inversion around 850mb should preclude any lake or marine influence from affecting cloudiness at 10kft. Any idea why these standing waves are there and apparently connected to the western shores of Lake Michigan (even up into central WI) when thermodynamically the lake shouldn't be influencing cloudiness that high up.
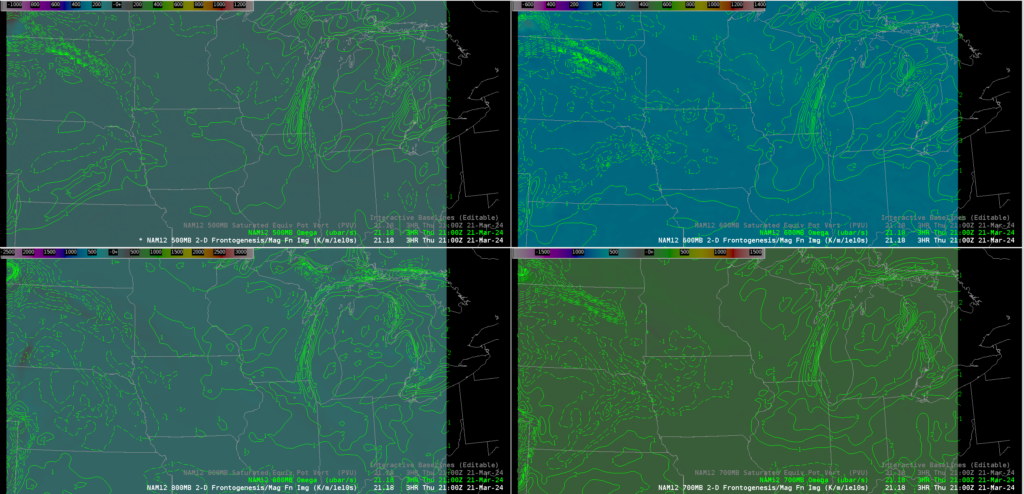
He followed up the email with NAM-12 output, below, showing a pretty good simulation of the rising/sinking motion couplet that might accompany such a band of clouds. In addition, this ACARS sounding from a plane landing at O’Hare, approaching from the southwest, shows stable air below 700 mb
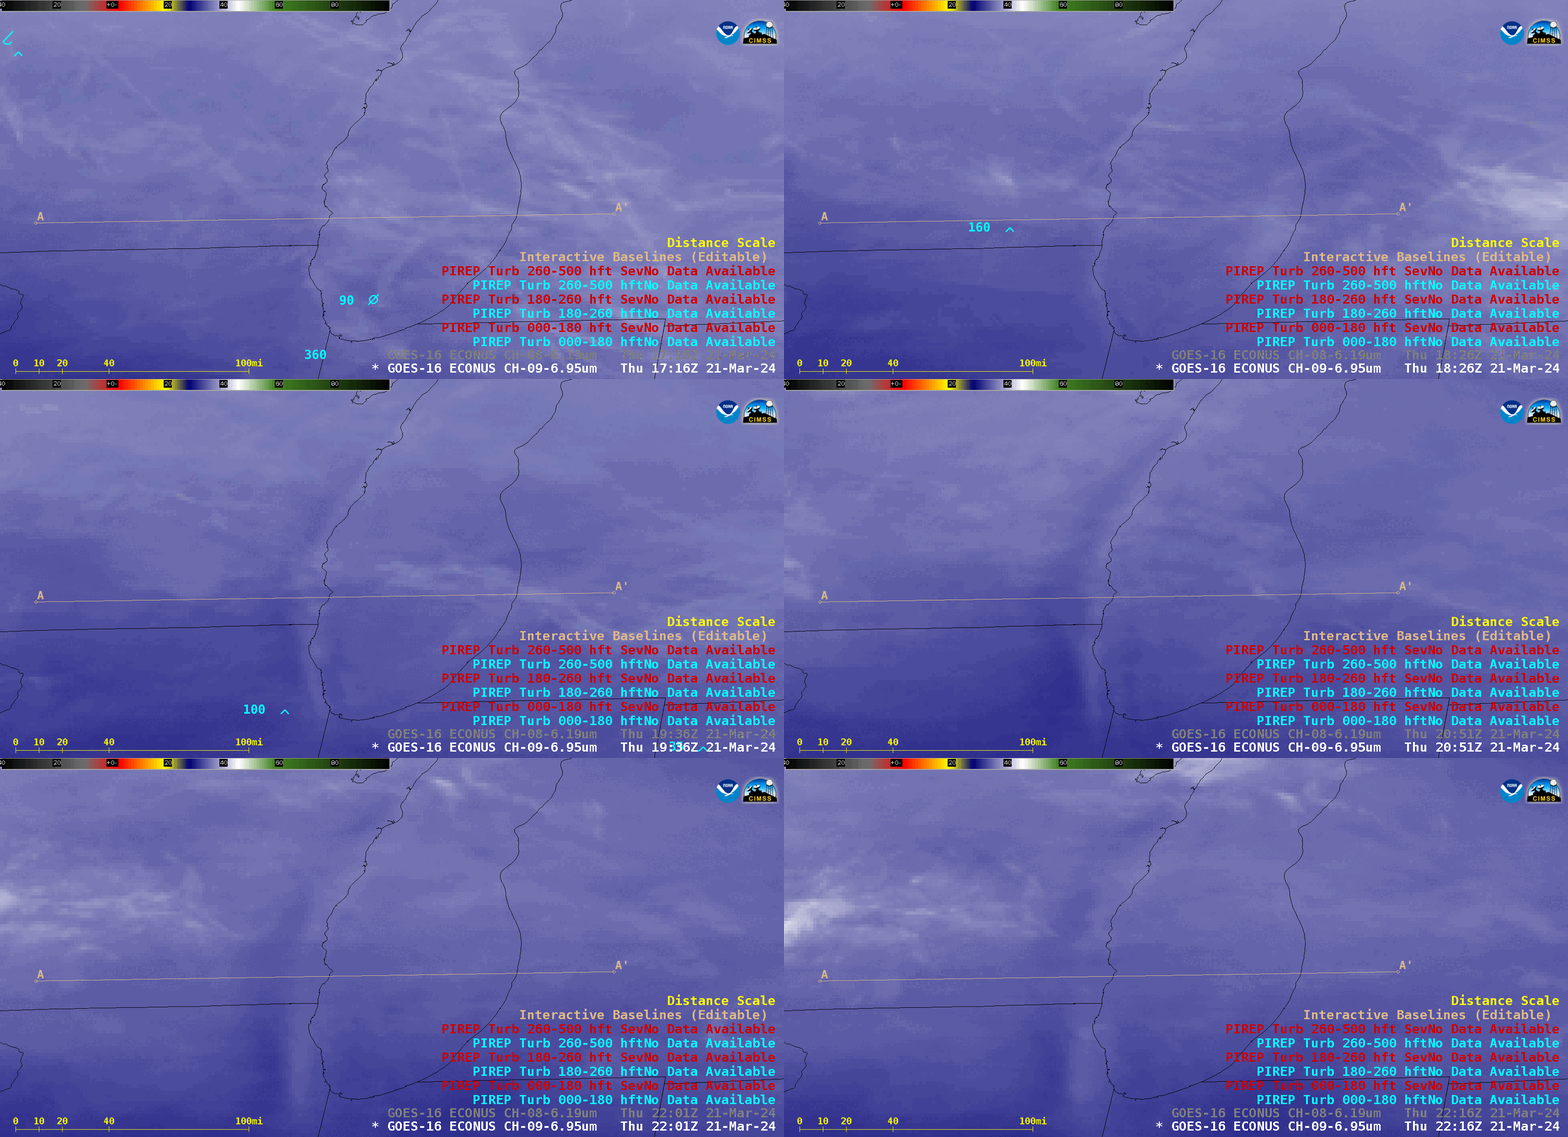
Mid-level water vapor infrared (Band 9, 6.95 µm) imagery below, from Scott Bachmeier, CIMSS, suggests cooler cloud tops along the Lake Michigan shoreline, but also warming upstream of that, suggesting, perhaps that downward motion is occurring immediately upwind of the cloud band. (Note also how a break in the cooler brightness temperatures develops over southeast Wisconsin).
West-to-east oriented cross sections of RAP40 model Omega and Winds along Baseline A-A’ (below) showed a fairly deep column of elevated subsidence (darker shades of blue to violet) just inland over southern Wisconsin, which roughly corresponded to the band of subsidence (warmer/dryer air, darker shades of blue) seen in GOES-16 Water Vapor imagery.
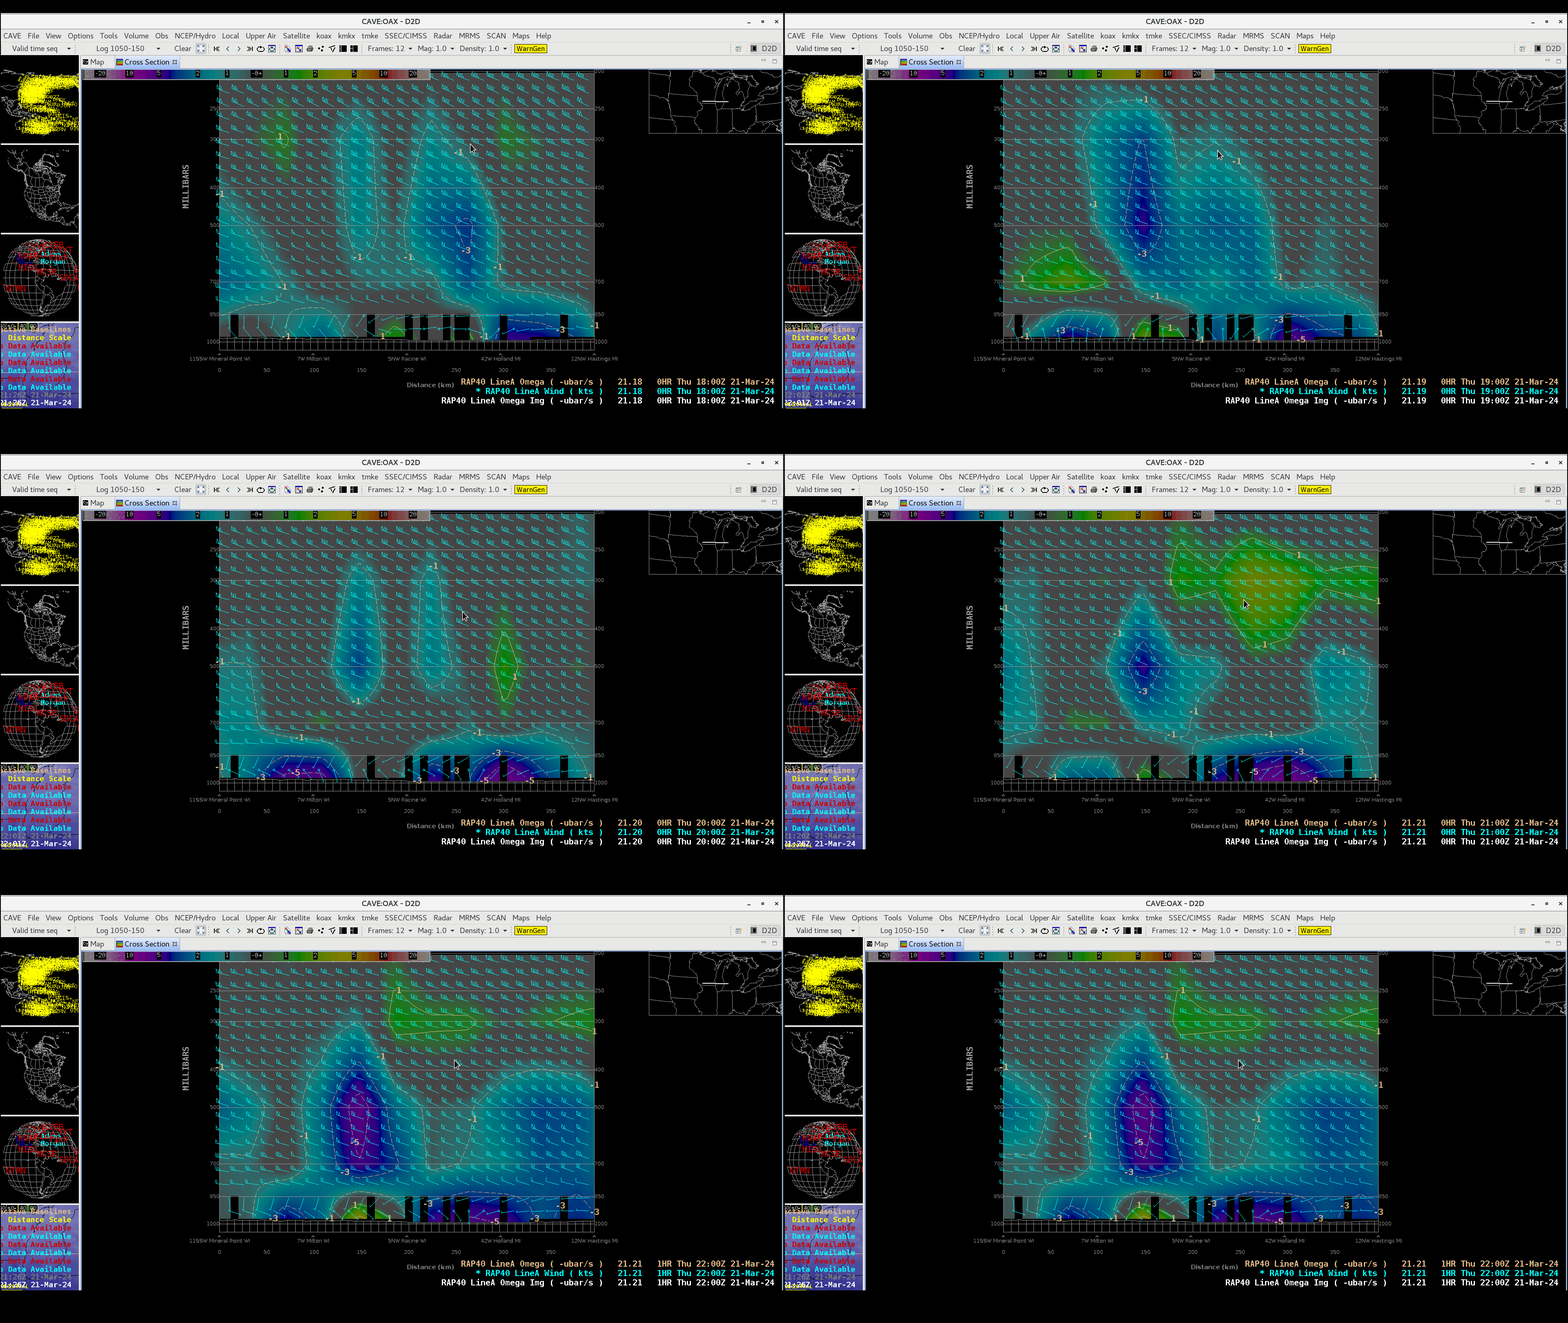
West-to-east oriented cross sections of RAP40 model Omega and Winds along Baseline A-A’, every hour from 1800-2200 UTC (courtesy Scott Bachmeier, CIMSS) [click to enlarge]
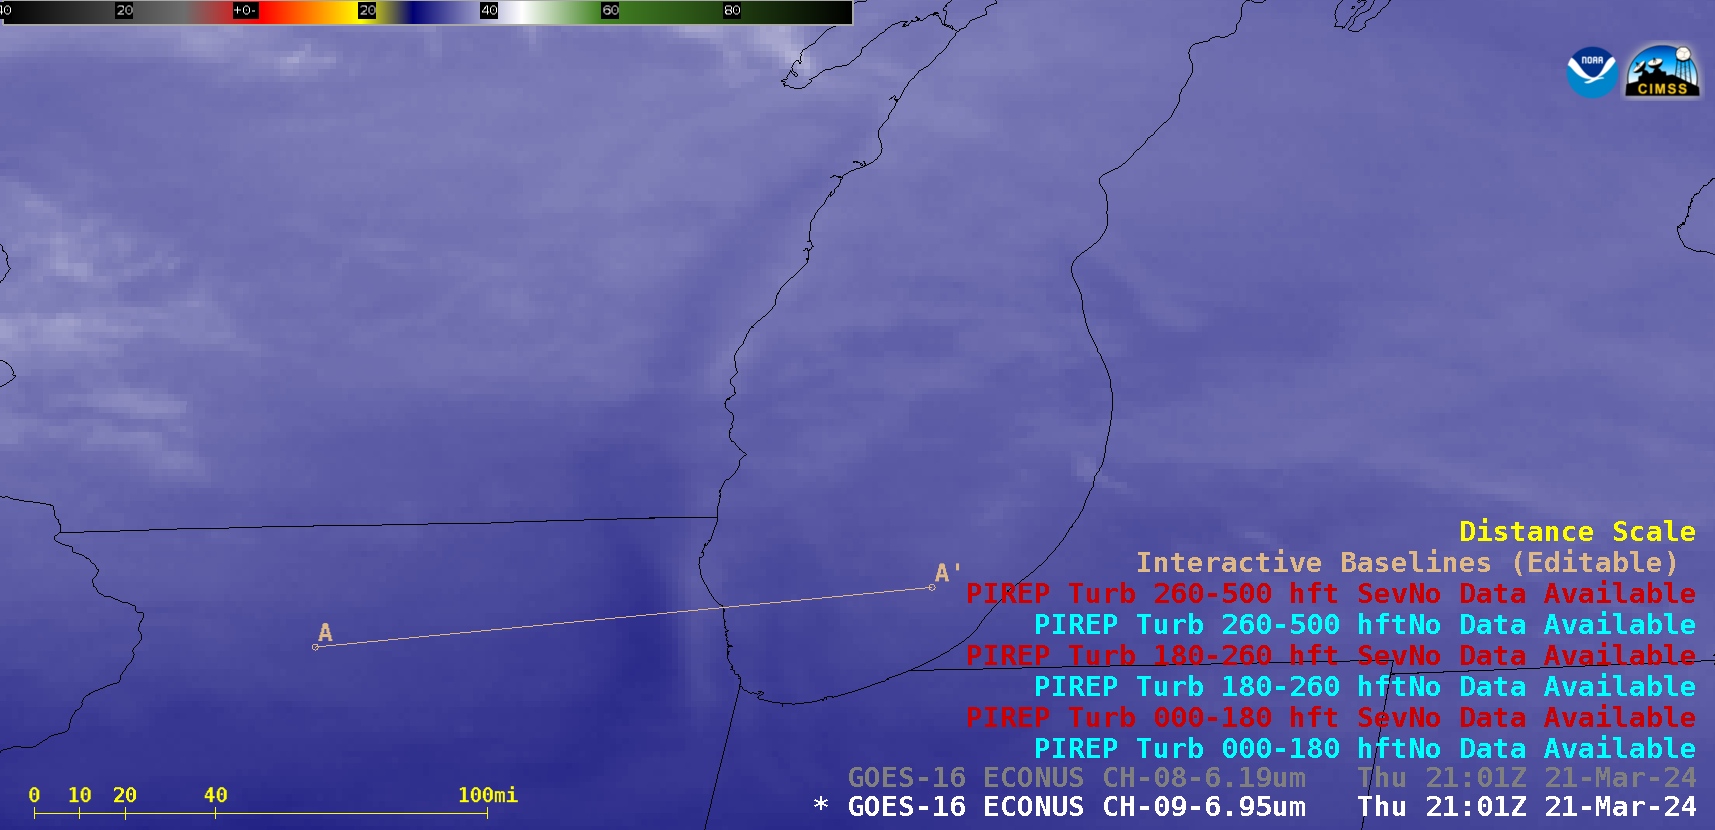
GOES-16 Water Vapor image at 2101 UTC, with Baseline A-A’ moved southward across the Chicago area [click to enlarge]
Relocating Baseline A-A’ farther south across the Chicago area, note the colder (brighter shades of white) signature of the cloud band seen just inland in 2101 UTC Water Vapor imagery (above), along with a signature of subsidence (darker shades of blue) immediately to the west — the 2100 UTC RAP40 Omega field (below) depicted an elevated couplet of downward (blue) / upward (green) motion located over those two Water Vapor features.
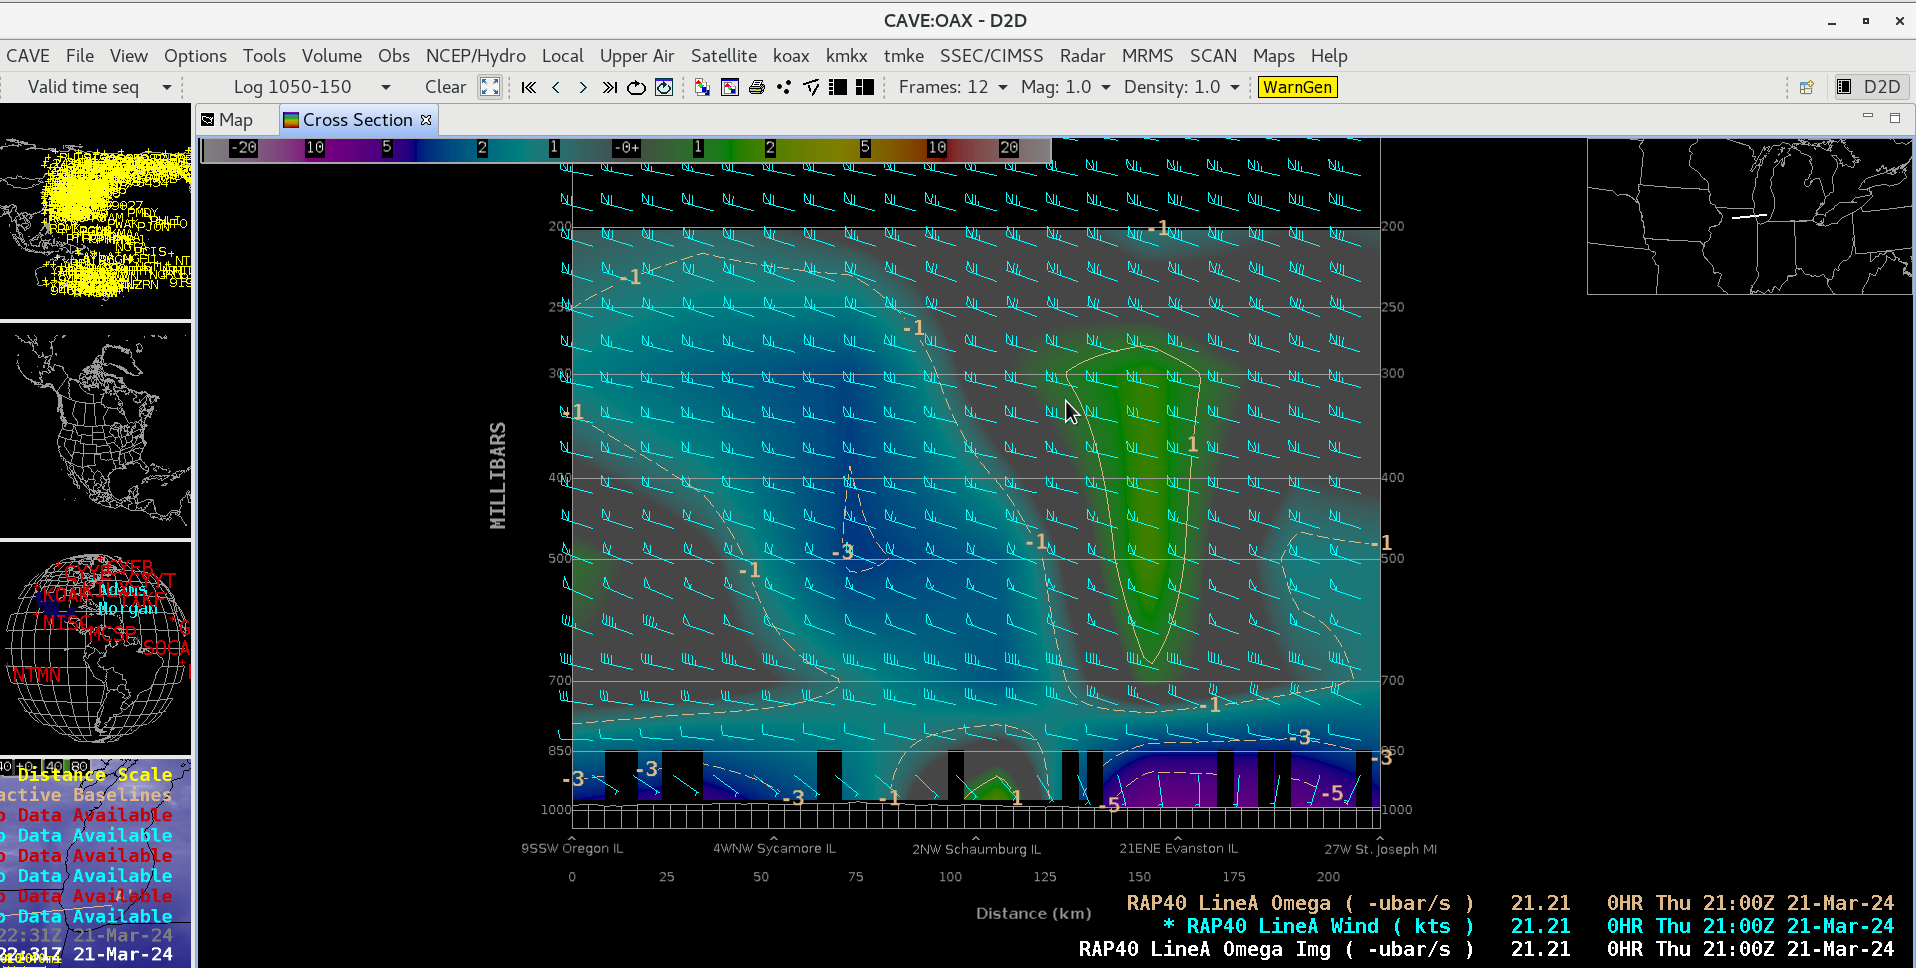
RAP40 model cross section of Omega and Winds at 2100 UTC, along Baseline A-A’ across the Chicago area [click to enlarge]
This write-up concludes with more questions than answers. The exact answer why the standing wave develops is not yet clear.
—————
Free Secure Email – Transcom Sigma
Transcom Hosting
Transcom Premium Domains
