Assessing the likelihood of rain during a drought
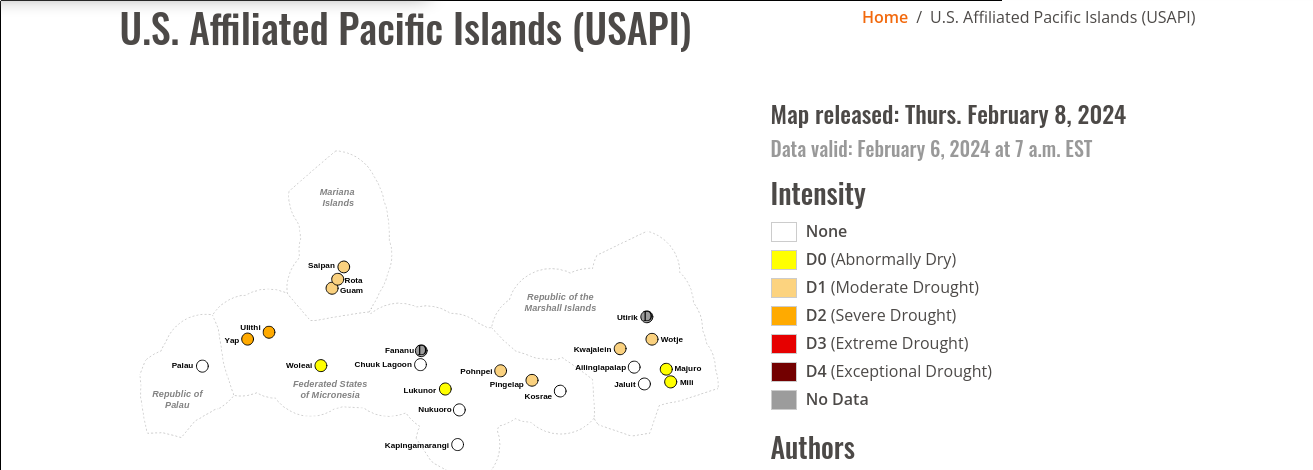
The US Drought Monitor for islands in the western Pacific Ocean, below, shows moderate to severe drought in some of the islands, especially those farthest from the Equator. Is there anything on the horizon that might bring rains?
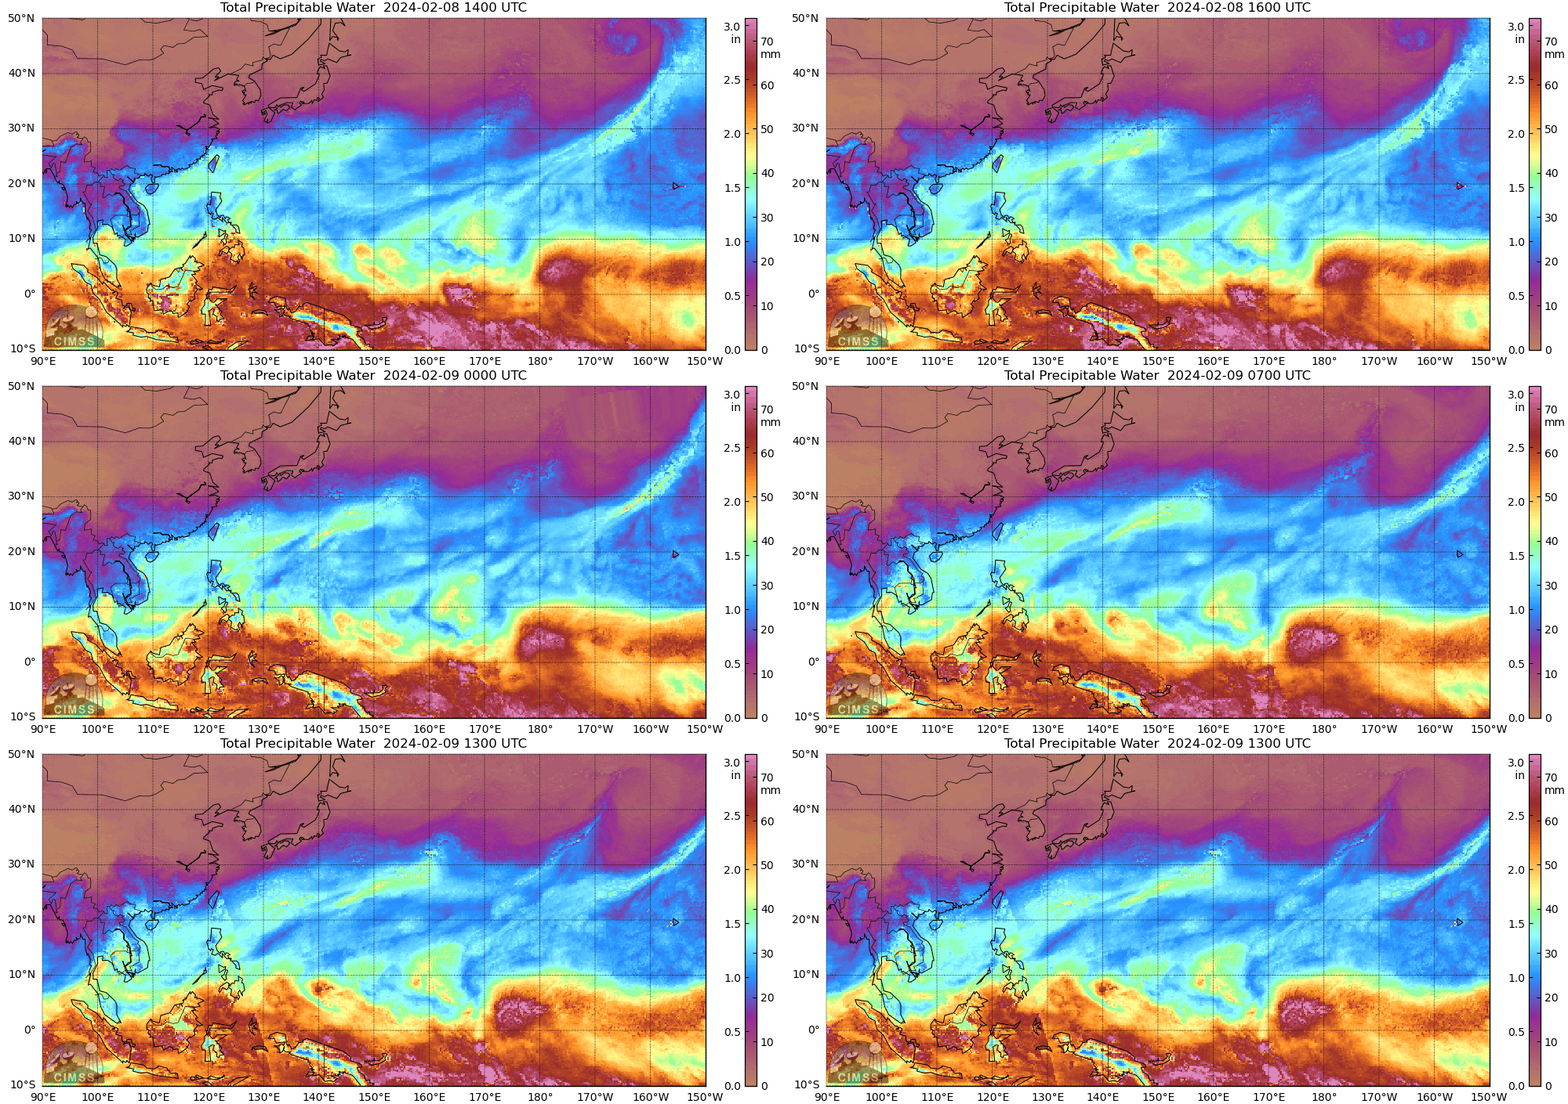
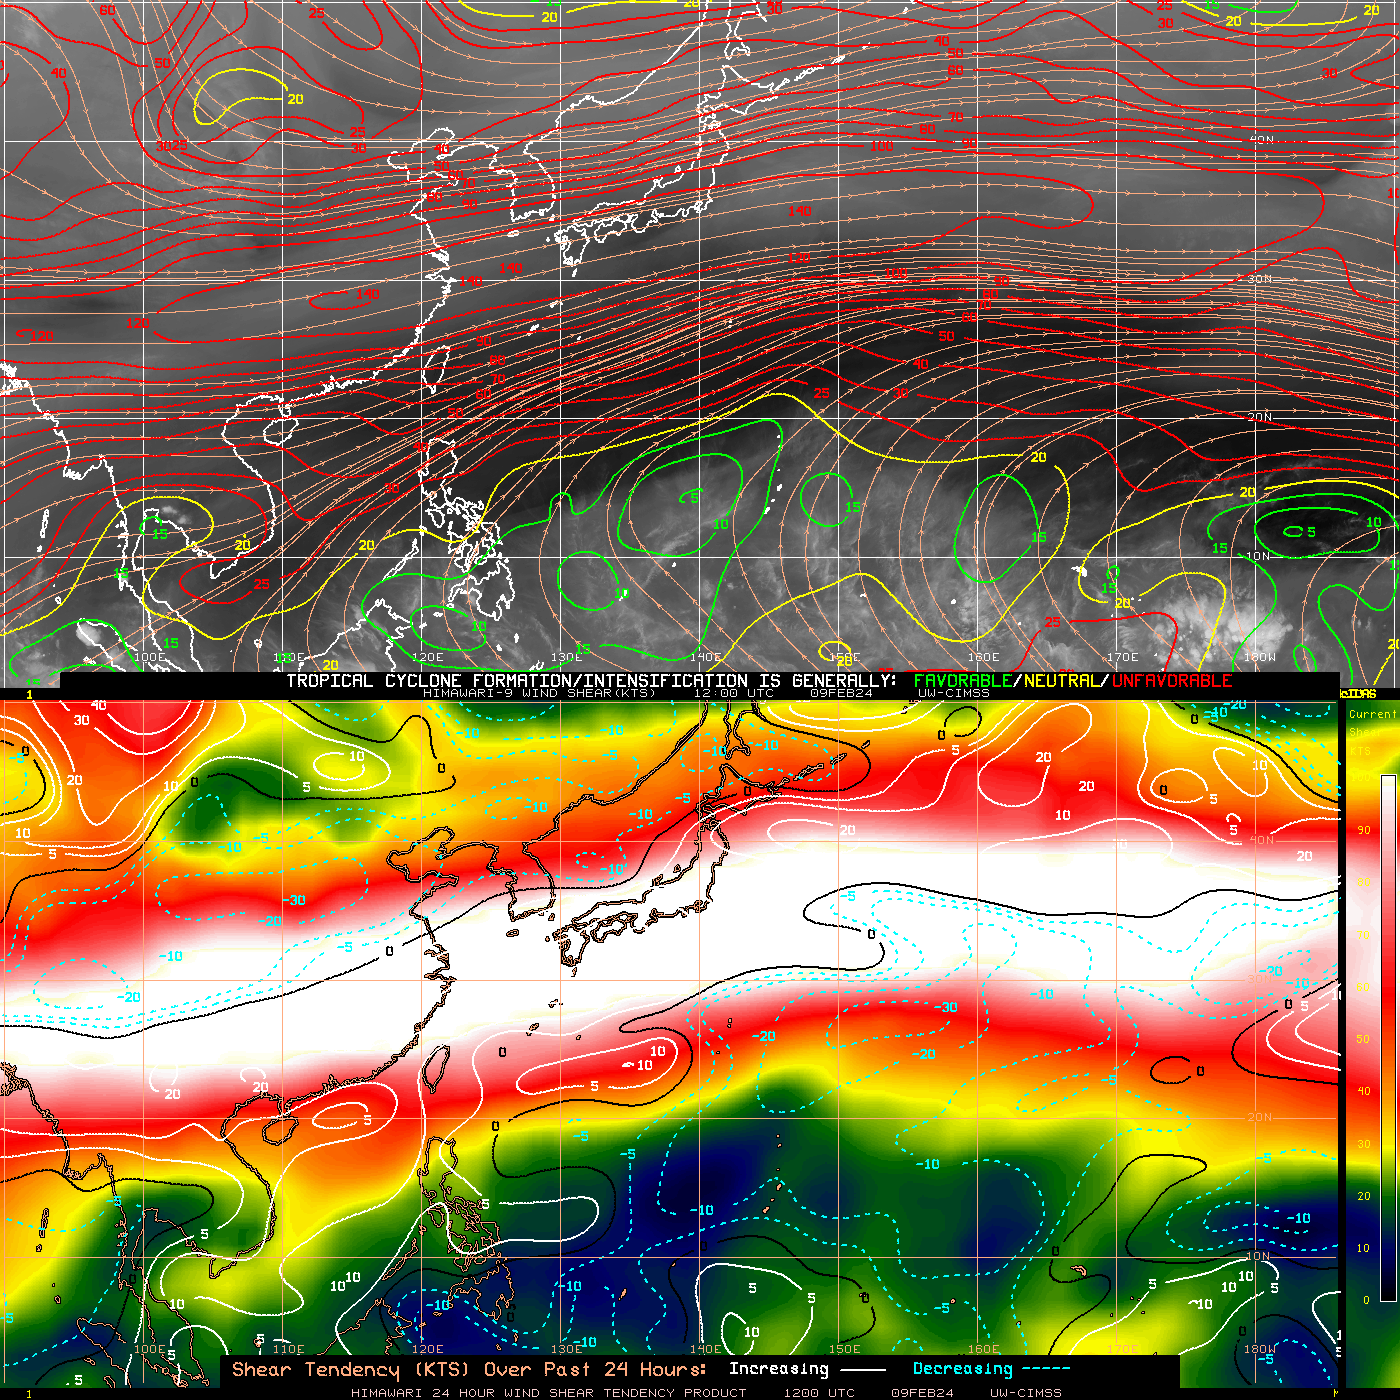
MIMIC Total Precipitable Water fields, below, show mostly dry conditions over the western Pacific with the notable exception of an impulse moving westward at 5oN latitude from 175oW to 175oE in the animation above. It is approaching Majuro at the end of the animation above (Majuro is at 7oN 171oE). What are the chances of tropical development with that rapidly-moving system. Shear is generally low over the system, and decreasing, and a small vortex is apparent at 850 mb.
Scatterometry (from MetopB and MetopC), can show information about low-level circulations. In this case, for example, ASCAT winds from MetopB winds at 1036 UTC — the western swath shown below — suggest a shear line, as winds shift from northeasterly to northerly around 4oN Latitude. In addition, at the western edge of the swath at 0845 UTC, winds shift from southeasterly to northeasterly. That is, there is surface convergence near 3oN, 177oW.
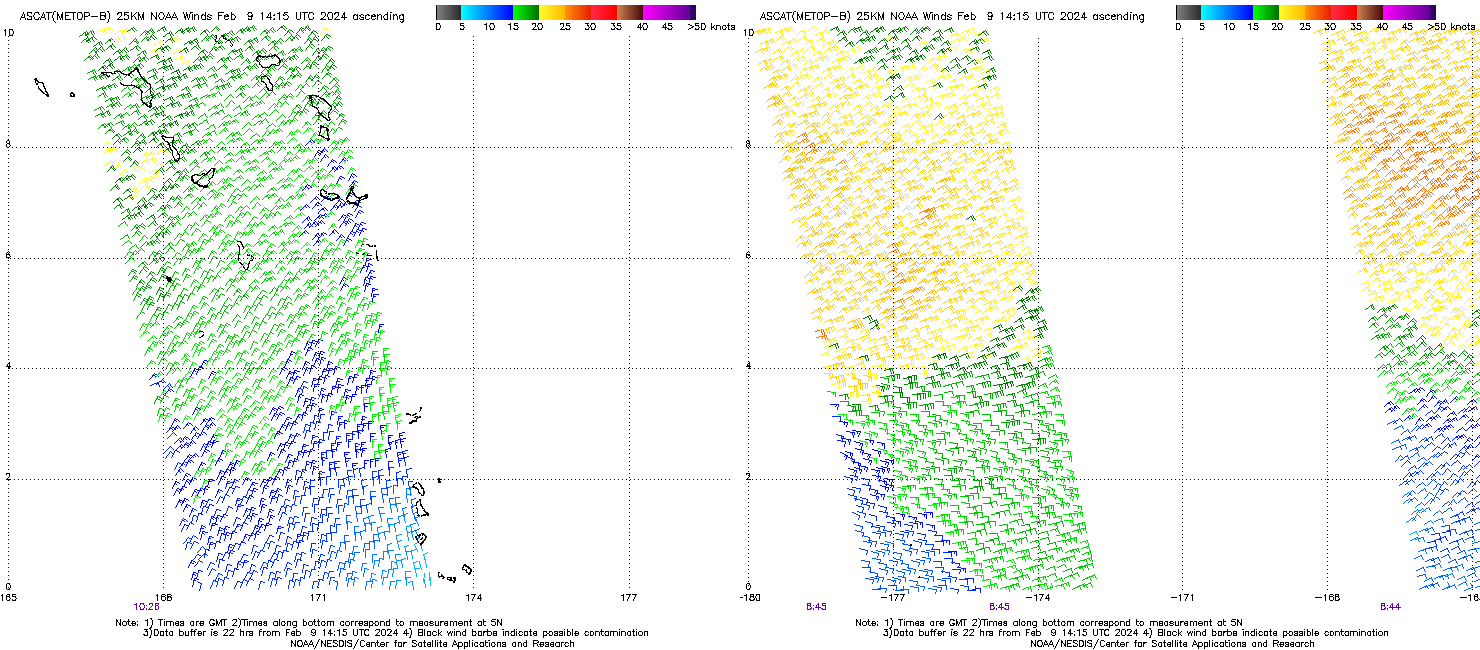
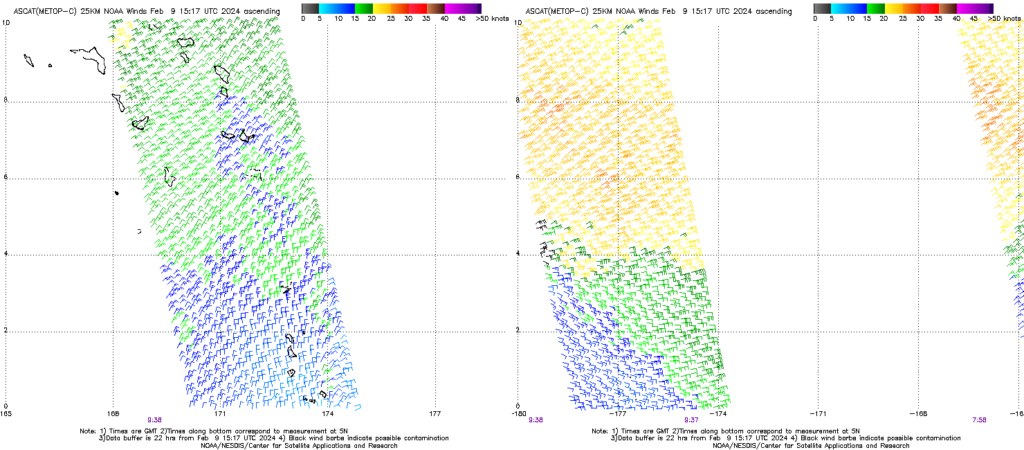
MetopC ASCAT winds at 0938 UTC, above, show the shear line perhaps more distinctly just east of 180o. The stronger winds — plotted in yellow — are from the east-northeast. The weaker winds in blue from the southeast. In the western swath, winds shift gradually from northeasterly north of 6oN to more northerly south of about 3oN. You will notice that a gap in observations is apparent just west of the dateline in both MetopB and MetopC ASCAT plots. Data from HY-2C can fill in region as shown below (from this website) shows the northeast winds curving to northerly winds.
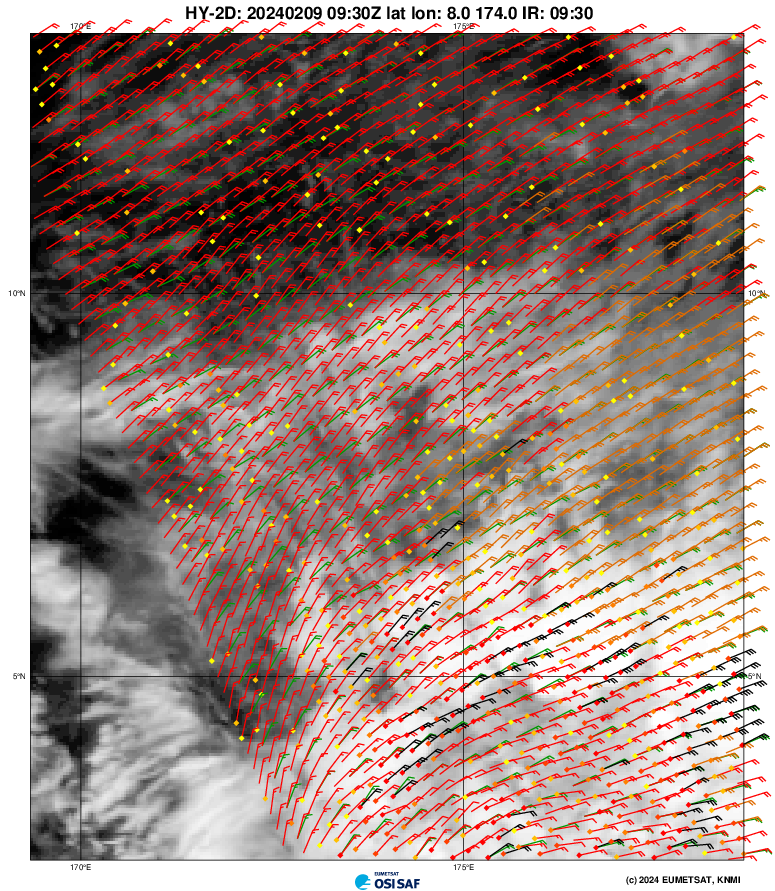
A conclusion one might draw is that a region of enhanced moisture will continue to propagate (without much further development) across the tropical Pacific with an enhanced shower threat south of 10oN from 170oE to 150oE over the next few days.
—————
Free Secure Email – Transcom Sigma
Transcom Hosting
Transcom Premium Domains
