Early-February thunder (and tornados!) over the Upper Midwest
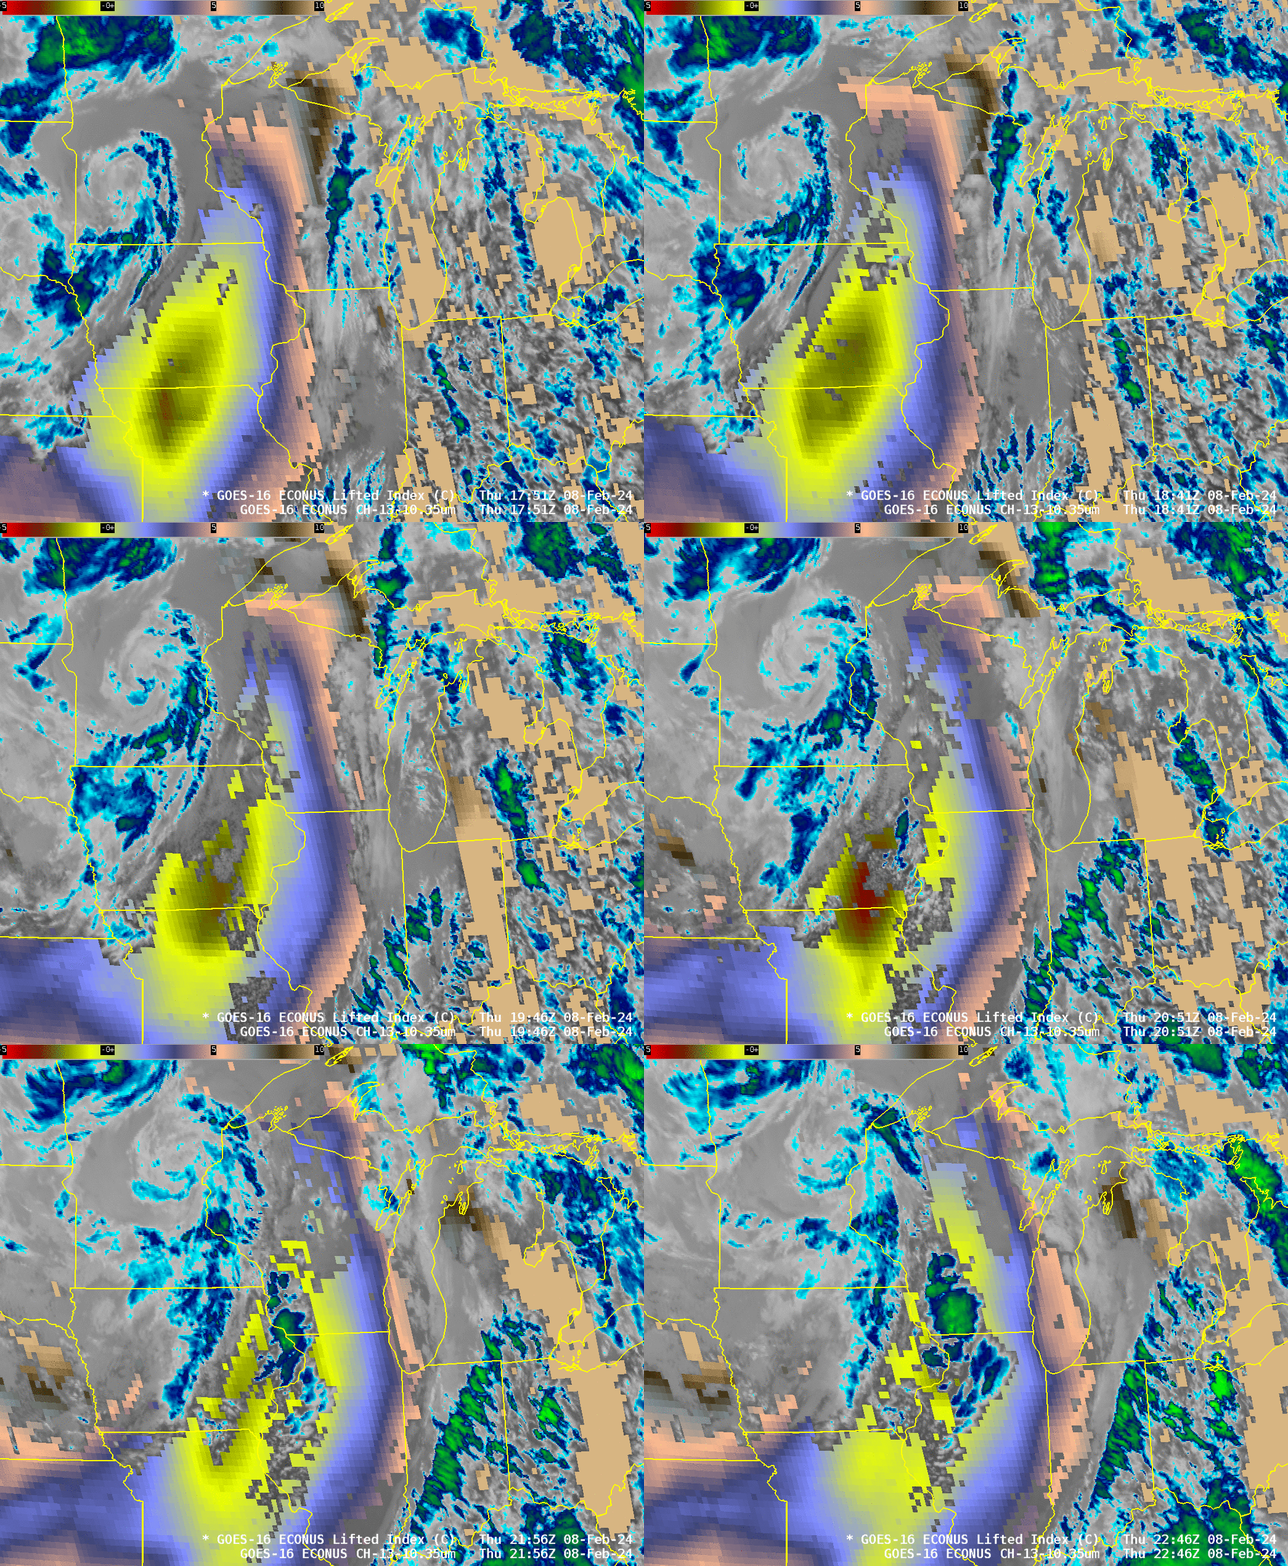
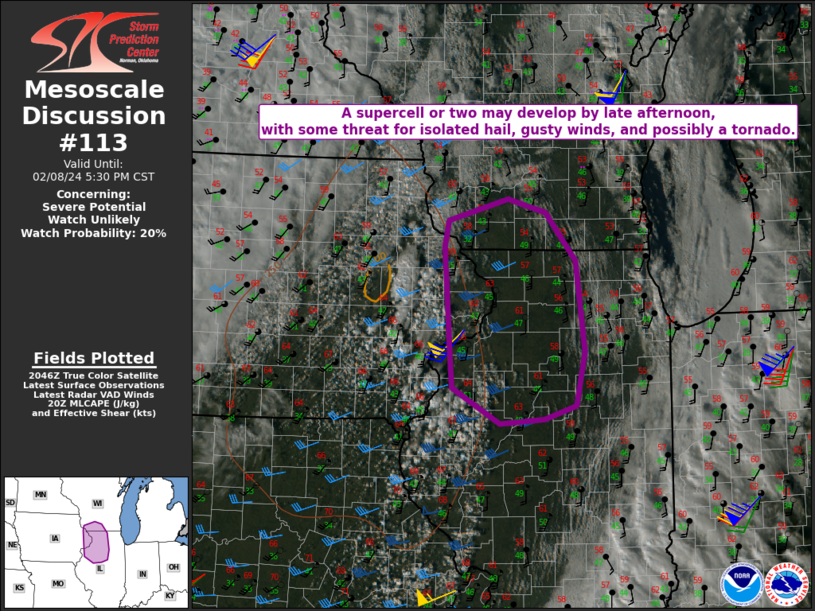
The Storm Prediction Center placed portions of the upper Midwest United States in a marginal risk of severe weather on 8 February 2024 and issued two mesoscale discussion on the thunderstorm development, one at 2053 UTC, one at 2345 UTC. The graphic from the 2053 UTC MD is shown below. The animation above shows clean window infrared imagery overlain by the Level 2 product Lifted Index (LI) that gauges the stability in the atmosphere. The AWIPS scaling for LI has been changed from the default to -5 to 10. Thunderstorms develop at the leading edge of the unstable air as it pushed into Wisconsin, and the first recorded February tornado in Wisconsin history was reported!
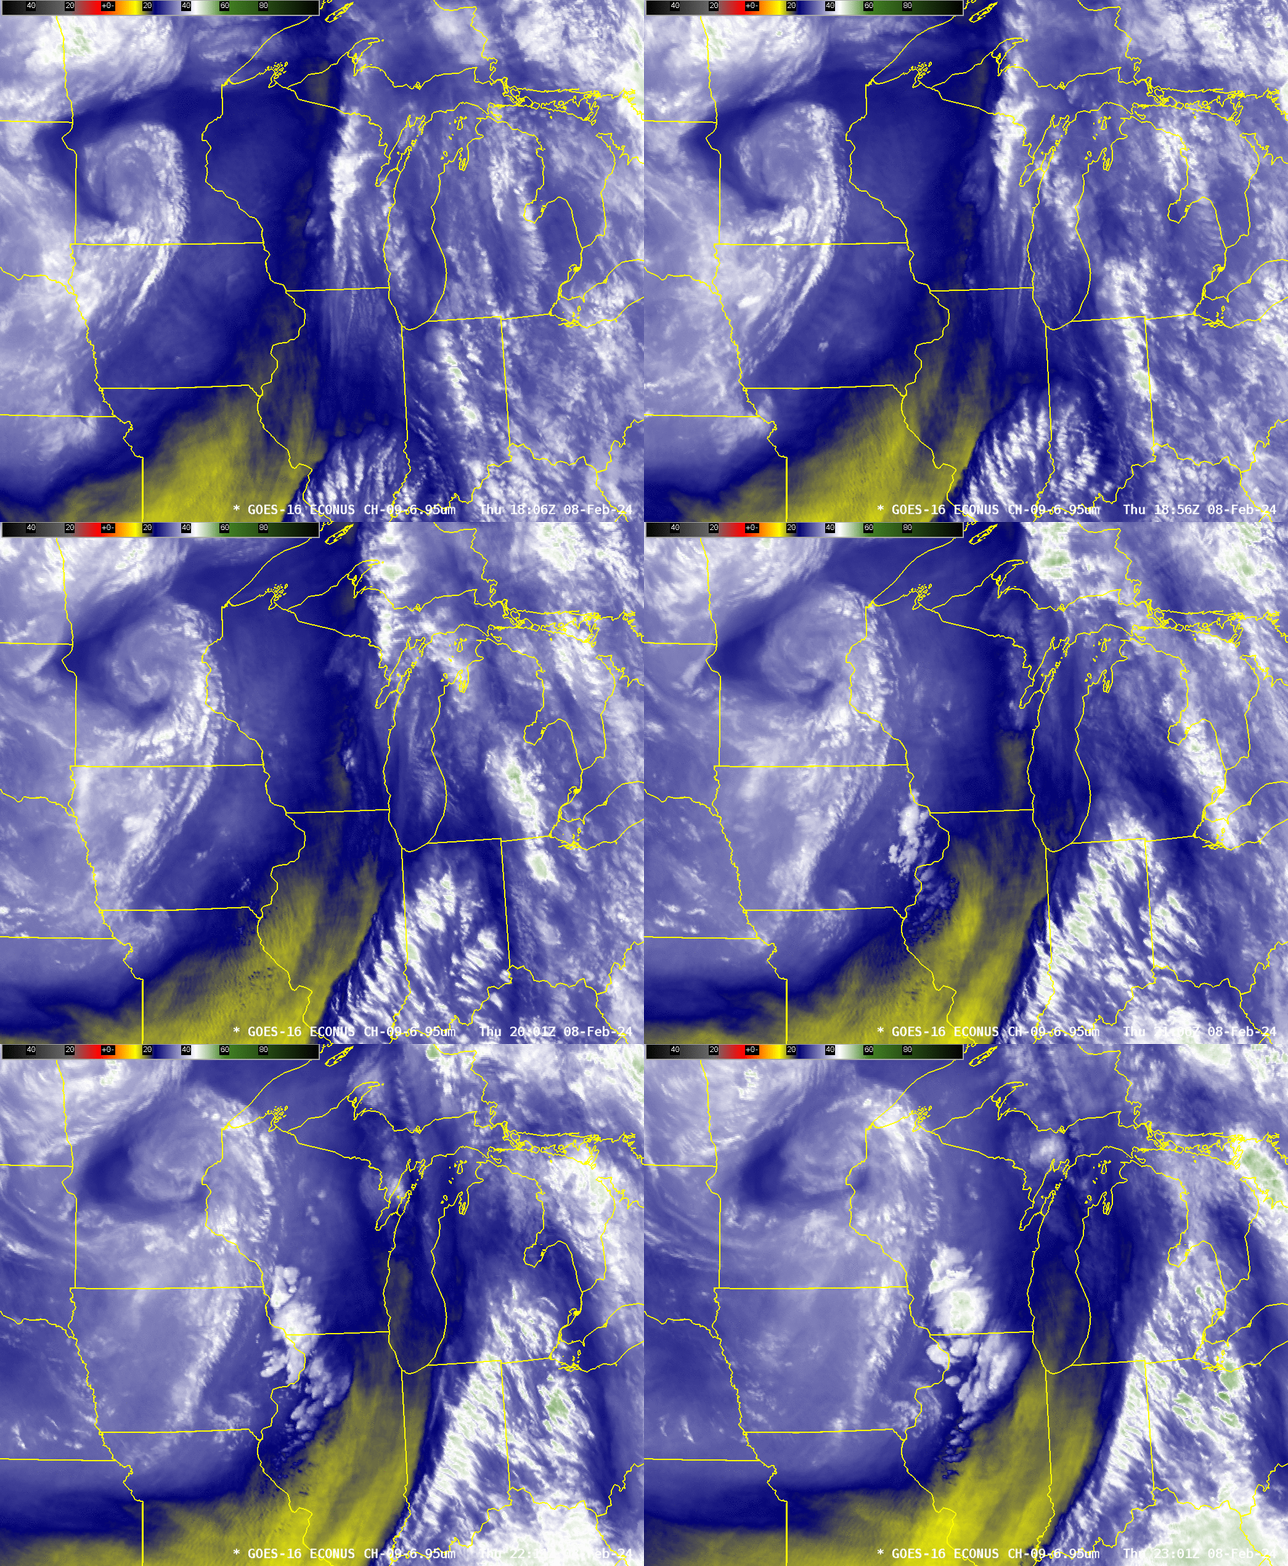
GOES-16 Mid-level Water Vapor infrared imagery, below, shows the evolution of the atmosphere over the upper-midwest as the convection developed. As in the Window Channel imagery above, the swirl of the large upper-level cyclone moving through central Minnesota is obvious. A more subtle feature moving northeastward from northwest Missouri through southern Iowa and into northwest Illinois at the end of the animation might also be affecting the developing convection
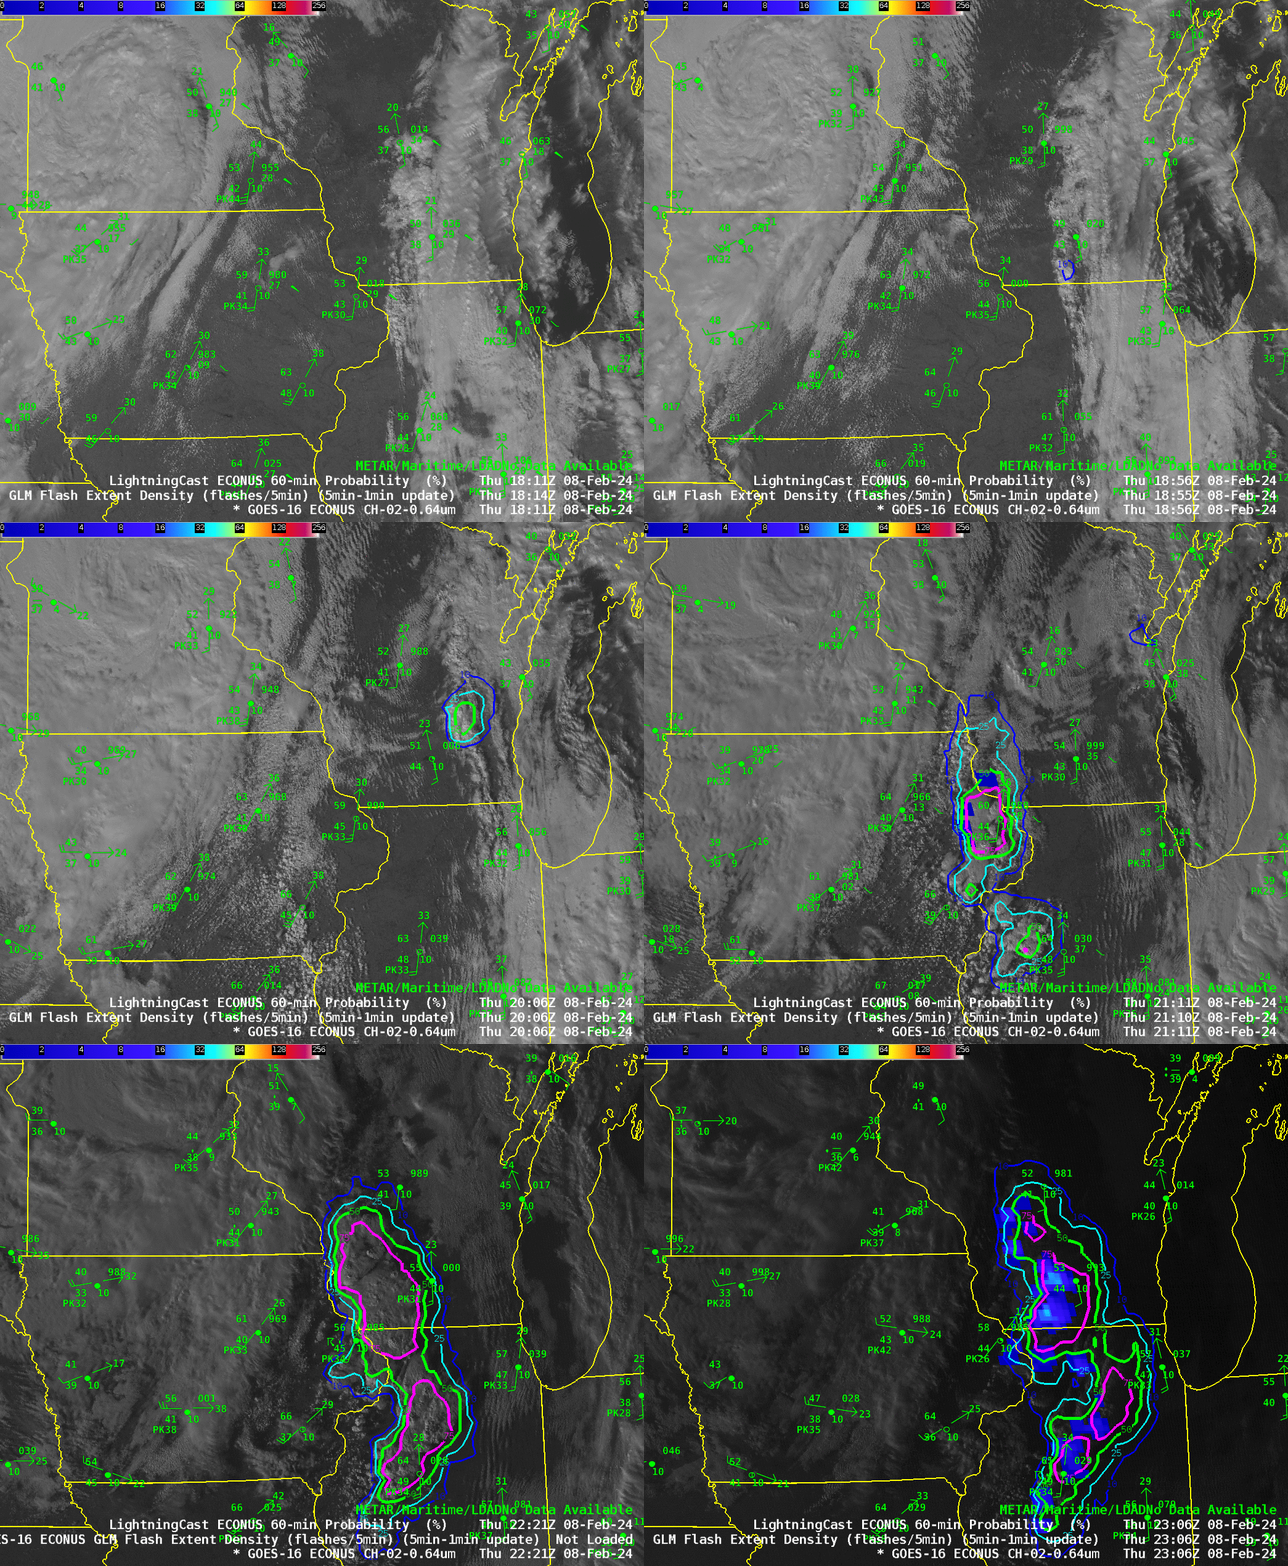
The animation below shows LightningCast probabilities contoured over visible imagery, and the probability product gave lead time in most cases during this unusual lightning event.
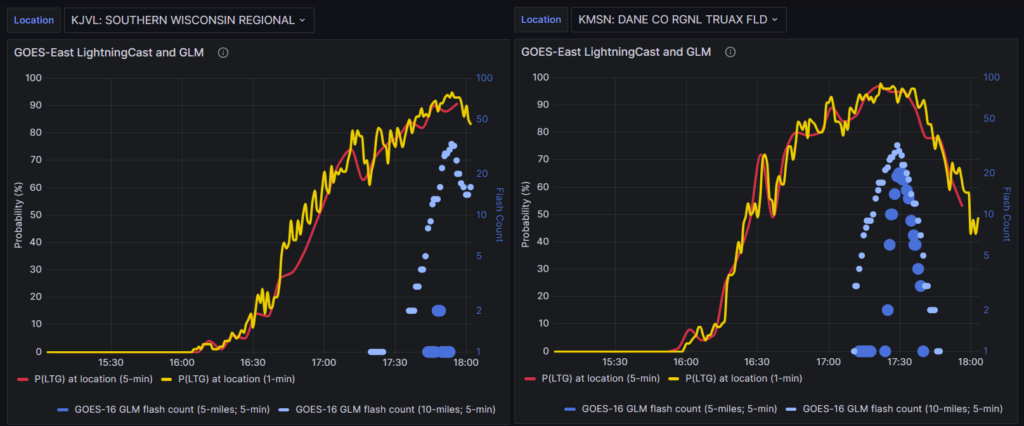
The LightningCast website (here) includes time series plots (‘Aviation Lightning Dashboards’) of Probabilities along with GLM observations. Data from Rock County (KJVL) and Dane County (KMSN) airports, below, show an increase in probabilities about an hour before the GLM observations occurred.
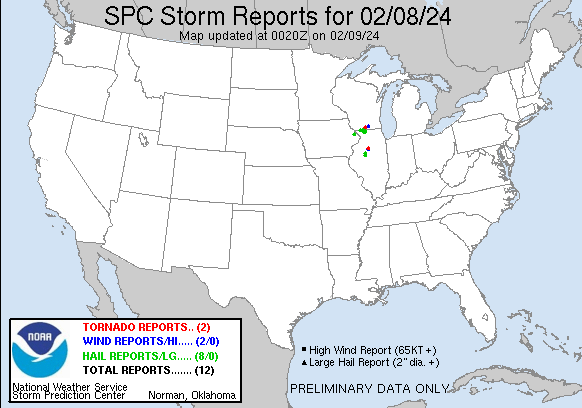
The most unusual aspect of this convective line in southern Wisconsin was the tornado it produced (link), as shown below. The 2337 UTC time of the tornado is after the animations shown above. Did ProbSevere give information for this tornado?
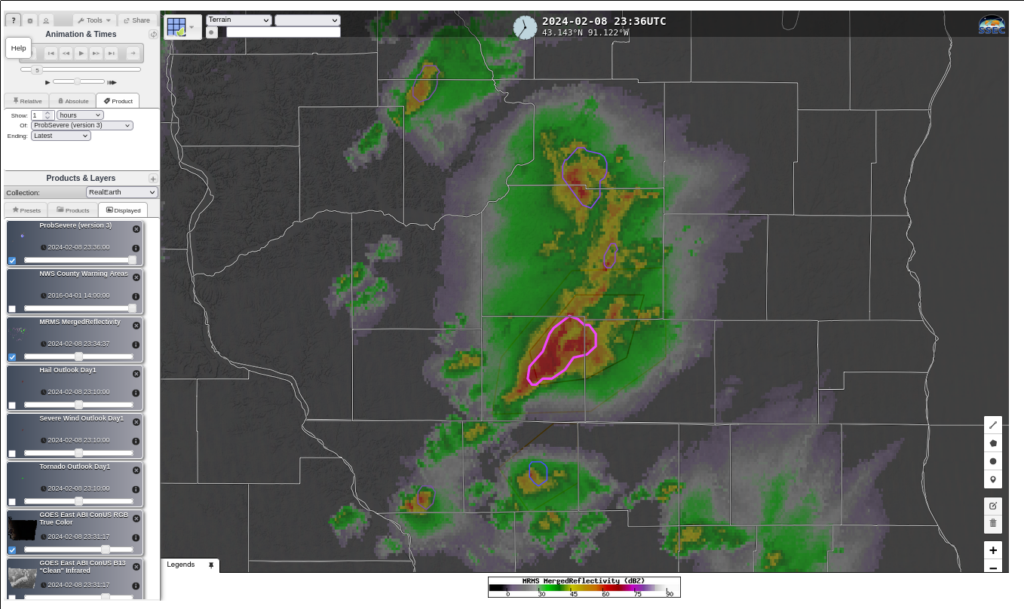
ProbSevere version 3 is available at this website and the screen-capture, below, shows the view at 2336 UTC, just before the tornado observation, when ProbSevere was at 70%. The time-series plot of the values within the ProbSevere object (#253605) is shown at bottom.
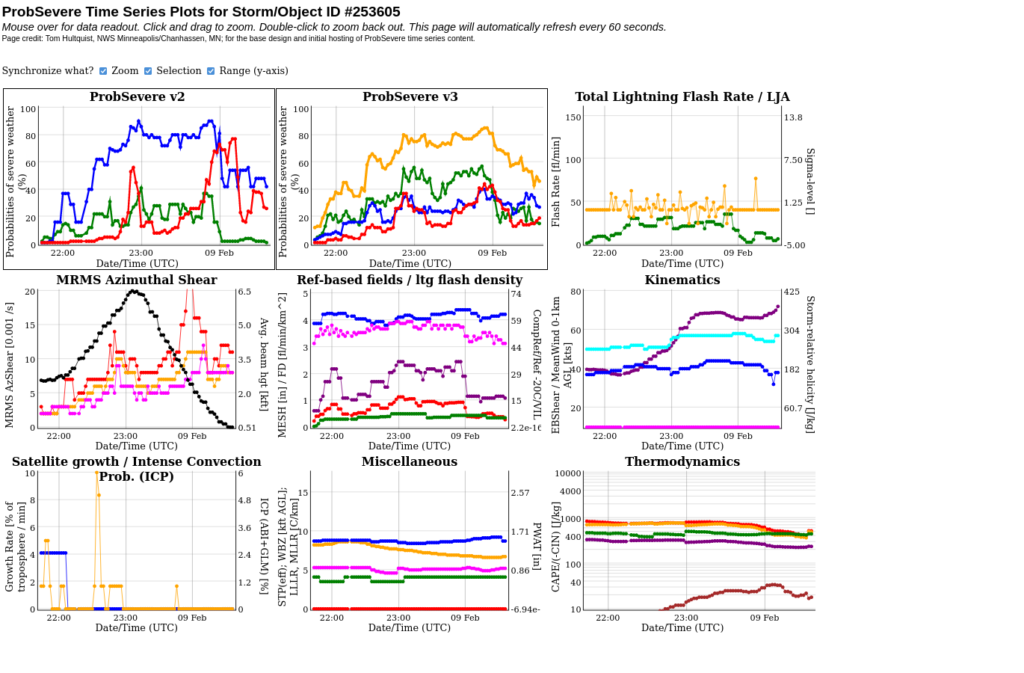
It’s difficult to isolate a signal in ProbSevere that unilaterally says a tornado is present. Storm-relative helicity (the purple line in the Kinematics plot) and Environmental Bulk Shear (the cyan line in the Kinematics plot) are suggestive, but no field shows a peak near 2337 UTC. Use products such a ProbSevere as a tool, along with others (satellite, radar, etc), to judge whether or not a warning is warranted. Note that a warning was issued for this cell at 2304 UTC on 8 February 2024.
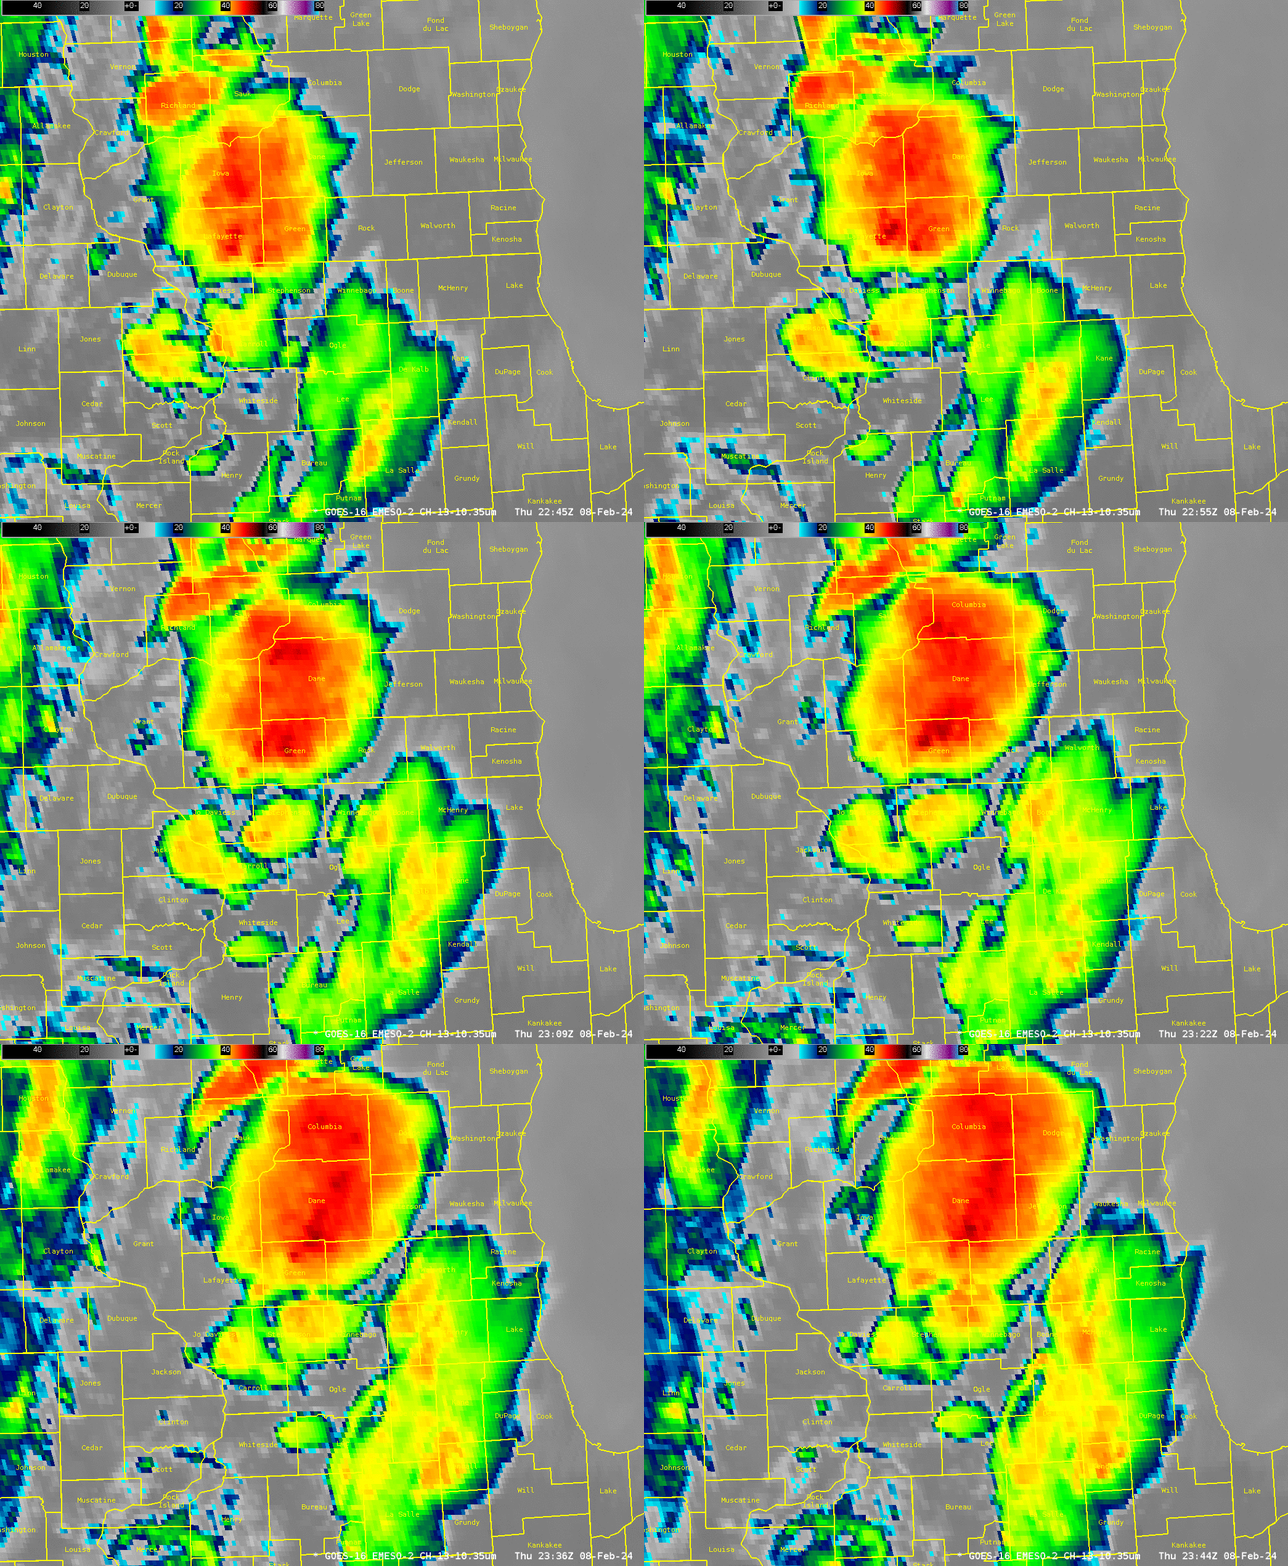
GOES-16 Mesoscale Sector 2 observed the Midwest at 1-minute intervals on 8 February. Band 13 imagery, below (rescaled so that the coldest cloud brightness temperatures are -80o C vs. the default -109o C), shows the cold cloud tops associated with the strong convection moving from Lafayette into Green County in Wisconsin.
—————
Free Secure Email – Transcom Sigma
Transcom Hosting
Transcom Premium Domains
