19 GOES
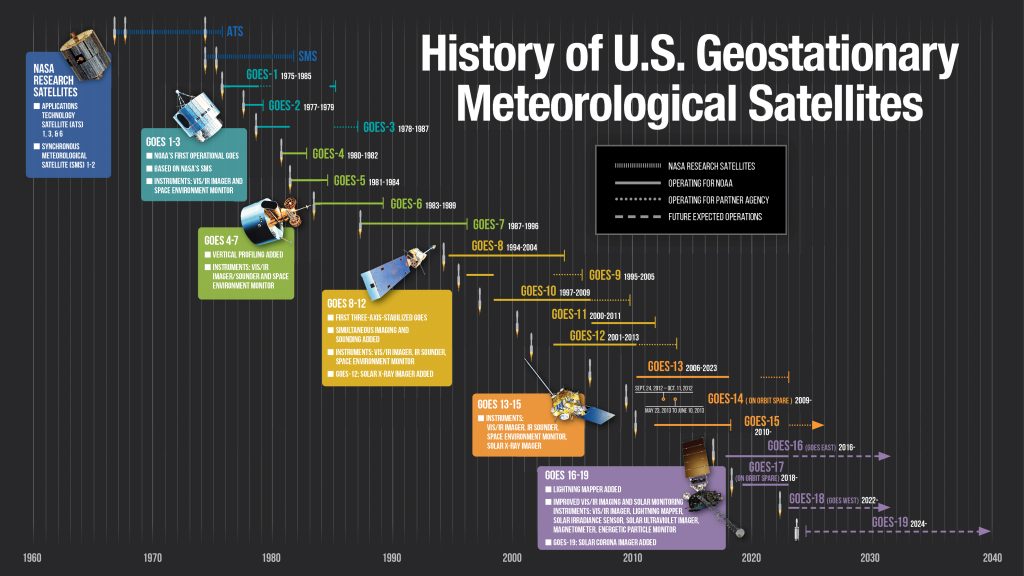
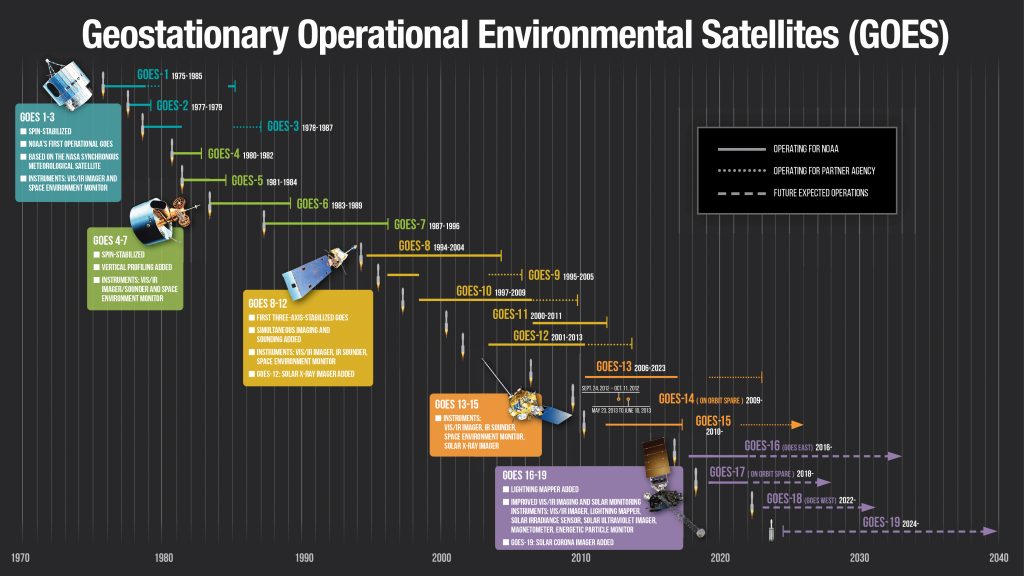
The GOES (Geostationary Operational Environmental Satellite) have been around since 1975, although there were earlier non-operational versions operated by NASA, such as ATS, which carried UW/Madison’s Verner Suomi‘s Spin-Scan Cloudcover Camera. The ATS was followed by the SMS, which carried an early version of the VISSR.


To prepare for the 50th anniversary of GOES, below is a collection of animations from each of the GOES, starting with GOES-1.
GOES-1
GOES-A (also known as SMS-C) was launched on October 16, 1975. The satellite became GOES-1 when it reached the geostationary orbit. More on the launch pad’s used for each GOES launch over the decades. Later the satellite was moved to be over the Indian Ocean, to support the GARP field experiment. The VISSR had one visible and one longwave window infrared (IR) band.
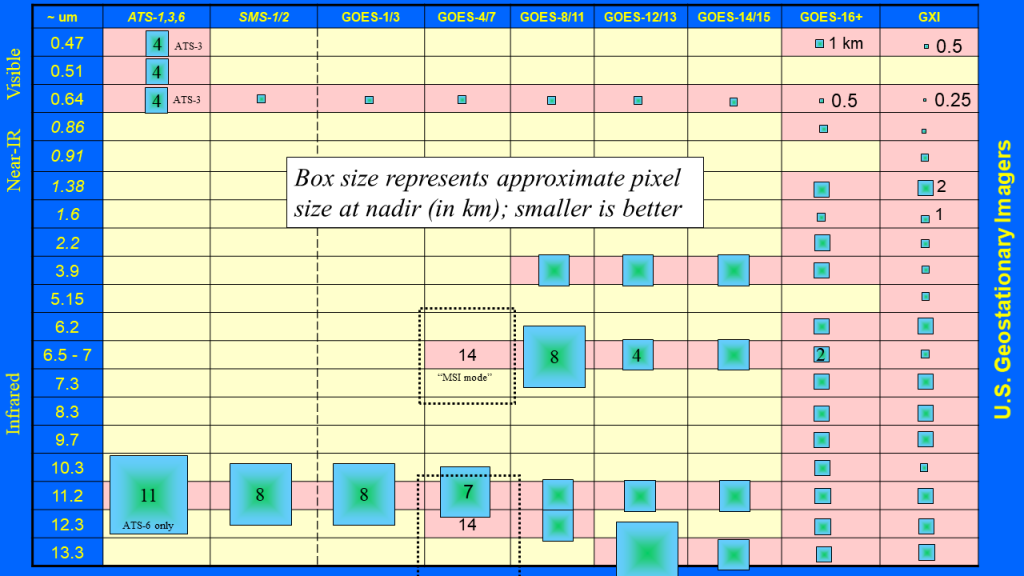
The approximate spatial resolution of the GOES-1 visible sensor was 1 km.
GOES-2
GOES-B was launched on June 16, 1977.
The IR band provides cloud information both during the day and night. The coldest pixels in the above IR image have been color-coded.
GOES-3
GOES-C was launched on June 16, 1978.
The Mt St Helens ash plume could be seen in both the visible and IR bands of GOES-3. SMS-2 also observed the ash cloud.
GOES-4
GOES-D was launched on September 9, 1980. This was the first U.S. GOES to include a water vapor spectral band. The animation below shows Hurricane Norma with the one visible band. Some striping can be seen, due to the type of detectors then used.
More GOES-4 related CIMSS Satellite Blog posts. In the Multi-Spectral Imaging (MSI) mode, one IR window band was scanned, with two other IR bands.
GOES-5
GOES-E was launched on May 22, 1981. This water vapor band shows a low off the East Coast. Warmer values are coded to be darker.
More GOES-5 related CIMSS Satellite Blog posts.
GOES-6
GOES-F was launched on April 28, 1983. Hurricane Raymond, in the eastern Pacific, can be seen. This storm was made famous in the 2018 movie “Adrift”.
More GOES-6 related CIMSS Satellite Blog posts.
GOES-G was a launch failure. This is one of the reasons that the U.S. only had one GOES for over 5 years.
GOES-7
GOES-H was launched on February 26, 1987. Being the only GOES for over 5 years, the spacecraft was moved seasonally to better observed upstream weather or the Atlantic for hurricane development. Hurricane Andrew was a very powerful storm, being a Cat 4 when it made landfall in Florida. (Unless it was a Cat 5.) And was a Cat 3 when it made landfall over the south-central Louisiana coast. The warmer IR values in the animation below are light-blue to green.
More GOES-7 related CIMSS Satellite Blog posts.
GOES-8
GOES-I was launched on April 13, 1994. A Midwest blizzard as seen with the water vapor band on the GOES-8 imager. Note the improved spatial resolutions from earlier geo images.
More GOES-8 related CIMSS Satellite Blog posts. And winter weather. Also see “Thank you GOES-8“, although many dead links, as the page is fairly old.
GOES-9
GOES-J was launched on May 23, 1995. After it’s operational service, GOES-9 operated for over two years (2003-2005) over the Western Pacific to support the JMA. 2004 was a very active year for typhoons.
The apparent “bouncing” of the Earth was caused for the increased inclination of the GOES-9 satellite. The moon was captured in one of the images. This was the possible with images from ATS to GOES-15, although the GOES-16/17/18/19 ABI data are remapped onto the Earth, so any moon shot is not included with the image that is available to users. More GOES-9 related CIMSS Satellite Blog posts. And those related to tropical cyclones.
GOES-10
GOES-K was launched on April 25, 1997. Although the GOES are often called “weather satellites”, they monitor much more, including volcanic ash. This is an example from the Tungurahua volcano in Ecuador.
More GOES-10 related CIMSS Satellite Blog posts. And blogs associated with ash plumes / volcanic activity. After it’s operational lifetime as GOES-West, the GOES-10 Imager (and later GOES-12) operated from 60W taking more rapid imagery of the Southern Hemisphere.
GOES-11
GOES-L was launched on May 3, 2000. “Ship tracks” are formed when “aerosols from the exhaust of ships causes a “cloud seeding effect”, which results in a higher concentration of smaller cloud droplets compared to the surrounding undisturbed cloud deck.” This results in warmer 3.9 µm values (not shown) and brighter visible reflectances.
More GOES-11 related CIMSS Satellite Blog posts. And posts related to “ship tracks“.
GOES-12
GOES-M was launched on July 23, 2001. This imager had improved spatial resolution of the water vapor band. The loop below shows the progression of Hurricane Katrina in 2005, as it first made landfall in Florida and then Louisiana.
More GOES-12 related CIMSS Satellite Blog posts. And a blog on Hurricane Katrina.
GOES-13
GOES-N was launched on May 24, 2006. GOES-13/14/15 used a newer spacecraft, one that allowed for more imaging during seasonal eclipse outages. This loop of Hurricane Matthew was well anticipated as the GOES-R rocket was in Florida awaiting it’s November launch date. The hurricane’s path was just off the eastern Florida coast.
More GOES-13 related CIMSS Satellite Blog posts. And more blogs on Hurricane Matthew.
GOES-14
GOES-O was launched on June 27, 2009. Several times GOES-14 was put into operational service, when there were issues with the operational GOES. It also supplied over 5 months of experimental 1-min data over parts of 2012 – 2016. These data helped prepare for the operational 1-min imagery from the GOES-R series Advanced Baseline Imager (ABI).
Note that the center point of the imagery changed each day, to follow the storm. More GOES-14 related CIMSS Satellite Blog posts.
GOES-15
GOES-P was launched on March 10, 2010.
More GOES-15 related CIMSS Satellite Blog posts. And more on the prototype Next Generation Fire System (NGFS).
GOES-Q was a spacecraft option not exercised.
GOES-16
GOES-R was launched on November 19, 2016. The GOES-R series carried the ABI, which was orders of magnitude improved over the legacy imagers. Before the instruments are ready for operational use, the quality of the data needs to be inspected. The first of these early data are called first light. For GOES-16, this was January 15, 2017 at 18 UTC. The animation shows both the individual ABI spectral bands, but also a number of Red-Green-Blue image composites, such as the airmass RGB for the day-cloud-phase RGB.
Another collection of top GOES-16 ABI animations. And more blogs with RGB imagery.
GOES-17
GOES-S was launched on March 1, 2018. There was a “rapid expansion of a volcanic cloud following an explosive eruption of Hunga Tonga–Hunga Ha`apai on 15 January 2022″. An abrupt shock wave was evident, which propagated radially outward in all directions. The GOES-17 ABI water vapor band time difference loop was chosen as the UW-Madison Cool Science Animation winner in 2022.
Another collection of top GOES-17 ABI animations. The GOES-17 ABI had a Loop Heat Pipe (LHP) issue so the detectors did not get as cold as designed or the other ABIs. This affected the image quality of several of the IR bands over certain parts of the day, during certain parts of the year.
GOES-18
GOES-T was launched on March 1, 2022. The loop below shows the smoke associated with the Park Fire in California (and fog) during the day (with the visible band) and “fire” RGB (at night) over many days. The location of Lake Tahoe is seen in the lower right part of the image.
Also see these “top” GOES animations from 2023. Also see this Satellite Liaison blog on the Park Fire.
GOES-19
GOES-U was launched on June 25, 2024. During the post-launch check-out phase, the GOES-19 ABI monitored a prolonged eruptive period of Popocatépetl in Mexico. The “ash” RGB is shown for a period of almost two weeks. This composite uses four of the ABI spectral bands. The GOES-19 ABI are early images (preliminary and non-operational), beta stage.
See the CIMSS Satellite Blog for other early GOES-19 animations. As well as the Satellite Liaison blog.
Summary
The first GOES leveraged the earlier experimental geostationary imagers, the ATS and SMS series. In fact, SMS-C became GOES-A/1.


There have been great advances in the spatial, spectral and temporal attributes of the U.S. geostationary imagers, starting with ATS, continuing with the ABI and projected for the future GXI. The GeoXO is also slated to carry an advanced infrared sounder (GXS). Of course there are other sensors on the GOES, including to monitor total lightning, as well space weather and the Sun.
H/T
Both McIDAS-X and geo2grid software was used in generating these images, using data via the UW/SSEC Data Services. More about GOES-16 and GOES-18. T. Schmit works for NOAA/NESDIS/STAR, from Madison, Wisconsin.
—————
Free Secure Email – Transcom Sigma
Transcom Hosting
Transcom Premium Domains
